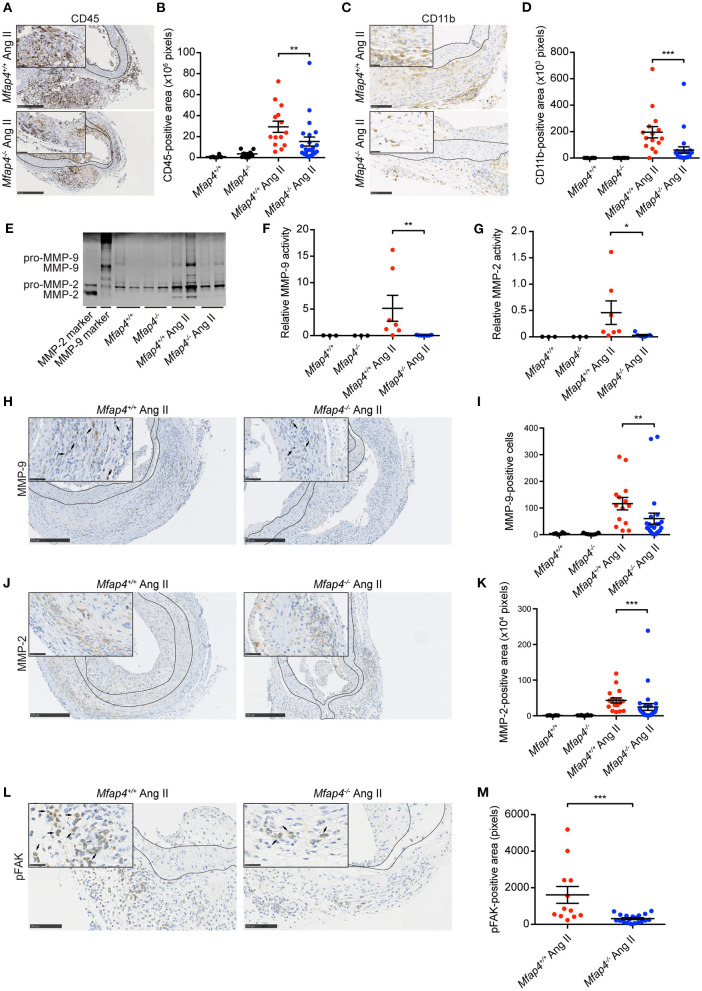
Figure 3.
Mfap4 deficiency reduces macrophage infiltration, MMP activity, and FAK activation in Ang II-induced AAAs. (A–D) Morphometric analysis of (A,B) CD45 and (C,D) CD11b stainings of aortic sections of ApoE−/− (Mfap4+/+) and ApoE−/−Mfap4−/− (Mfap4−/−) mice after 28 days of Ang II infusion. n = 6–8 (saline), 14–24 (Ang II). (E–G) Representative MMP zymogram (E) of aortic lysates from saline- and Ang II-infused mice after 9 days with corresponding densitometric quantification of (F) MMP-9 and (G) MMP-2 activity. n = 3–7. (H–M) Morphometric analysis of (H,I) MMP-9, (J,K) MMP-2, and (L,M) phosphorylated FAK (pFAK) stainings of aortic sections of ApoE−/− (Mfap4+/+) and ApoE−/−Mfap4−/− (Mfap4−/−) mice after 28 days of Ang II infusion. Black arrows indicate examples of positive cells. Black lines delineate borders between intimal, medial and adventitial layers. n = 6–8 (saline), 12–26 (Ang II). Representative pictures are shown. Scale bar = 250 μm/50 μm (A,H,J), 100 μm/25 μm (B,L). *p < 0.05, **p < 0.01, ***p < 0.001, analyzed with Mann-Whitney U-test.

