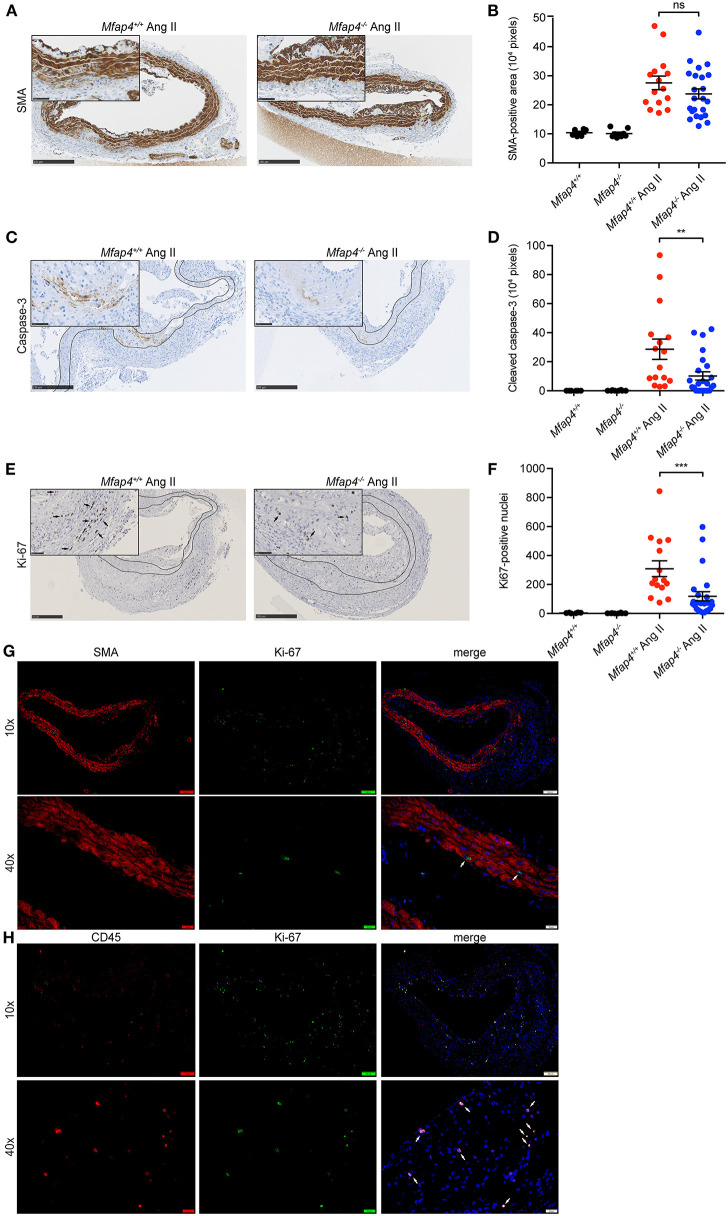
Figure 4.
Mfap4 deficiency reduces cellular proliferation and apoptosis in Ang II-induced AAAs. Morphometric analysis of (A,B) α-smooth muscle actin (SMA), (C,D) cleaved caspase-3, and (E,F) Ki-67 stainings of aortic sections of ApoE−/− (Mfap4+/+) and ApoE−/−Mfap4−/− (Mfap4−/−) mice after 28 days of Ang II infusion. Black arrows indicate examples of positive cells. Black lines delineate borders between intimal, medial and adventitial layers. (G,H) Double immunofluorescent staining of Ki-67 and SMA (G) or CD45 (H). White arrows indicate examples of double-positive cells. n = 6–8 (saline), 15–26 (Ang II). Representative pictures are shown. Scale bar = 250 μm/50 μm (A,C,E), 100 μm/20 μm (G,H). **p < 0.01, ***p < 0.001, analyzed with Mann-Whitney U-test. ns, non-significant.

