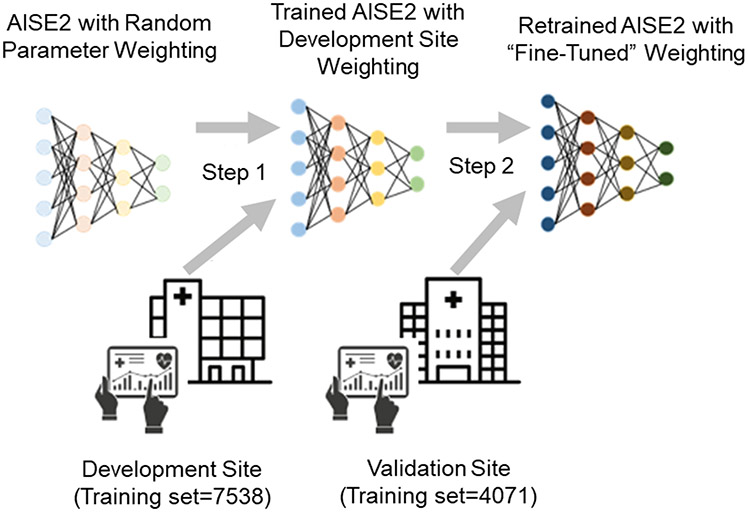
Figure 1: Schematic diagram of domain adaptation*.
*-The connections between each node in the AISE2 model are initially assigned random “weights” to determine model output. The model was trained on a sample of data from the development site (the training set), which updated the model weights (step 1). Before the model was applied to a remote external site, domain adaptation was used to refine the model weights using a sample of new training data from the remote (validation) site (step 2). Therefore, the model was customized for prediction at the validation site.

