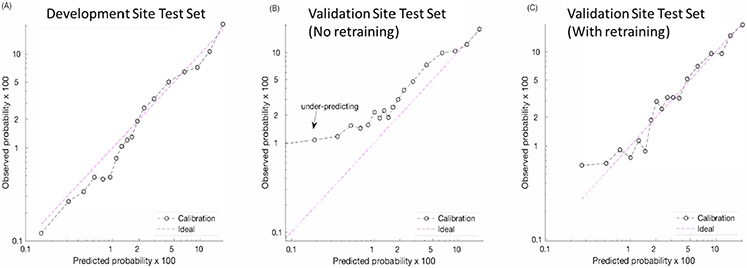
Figure 4: Calibration plots*.
*-Observations were binned into quantiles; each point represented an average of the observations in each quantile. Log-log scales were used for better visualization. The left-most plot shows the calibration plot of the model on the testing set of the development site. Due to the higher incidence of sepsis-associated vasopressor use at the validation site, the original model under-predicted the probability of that outcome at lower ranges of predicted risk (center plot). The fine-tuned model using domain adaptation (right-most plot) had better discrimination and calibration properties.

