Figure 3.
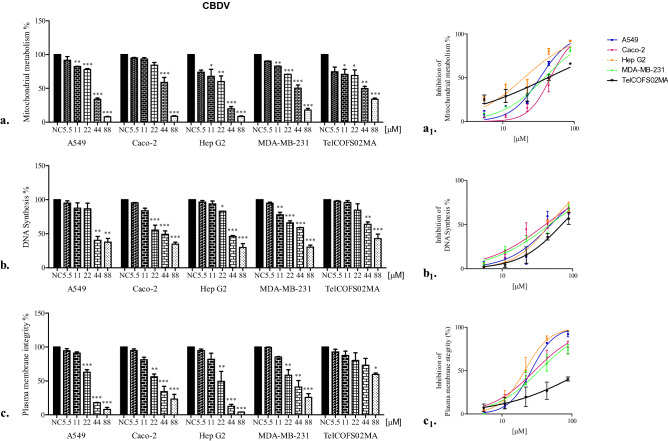
Percentages of cellular mitochondrial metabolism, DNA synthesis and plasma membrane integrity after 72 h of CBDV exposure. Percentages of cellular mitochondrial metabolism (a), DNA synthesis (b) and plasma membrane integrity (c) after 72 h of exposure of the A549, Caco-2, HepG2, MDA-MB-231, and TelCOFS02MA cell lines to different concentrations of CBDV. The results are expressed as the means ± standard deviations on the basis of five independent experiments. Significant differences compared to the negative controls are highlighted by asterisks (ANOVA, Dunnett’s test—*p < 0.05; **p < 0.001; ***p < 0.0001). Percentages of inhibition of cellular mitochondrial metabolism (a1), inhibited DNA synthesis (b1), and inhibition of plasma membrane integrity (c1) after 72 h of exposure are reported in concentration [µM]-effect curves. NC: negative control.

