
Figure 3. Correlation between functional connectivity from Ventral Striatum seed and Drinks per Drinking Day.
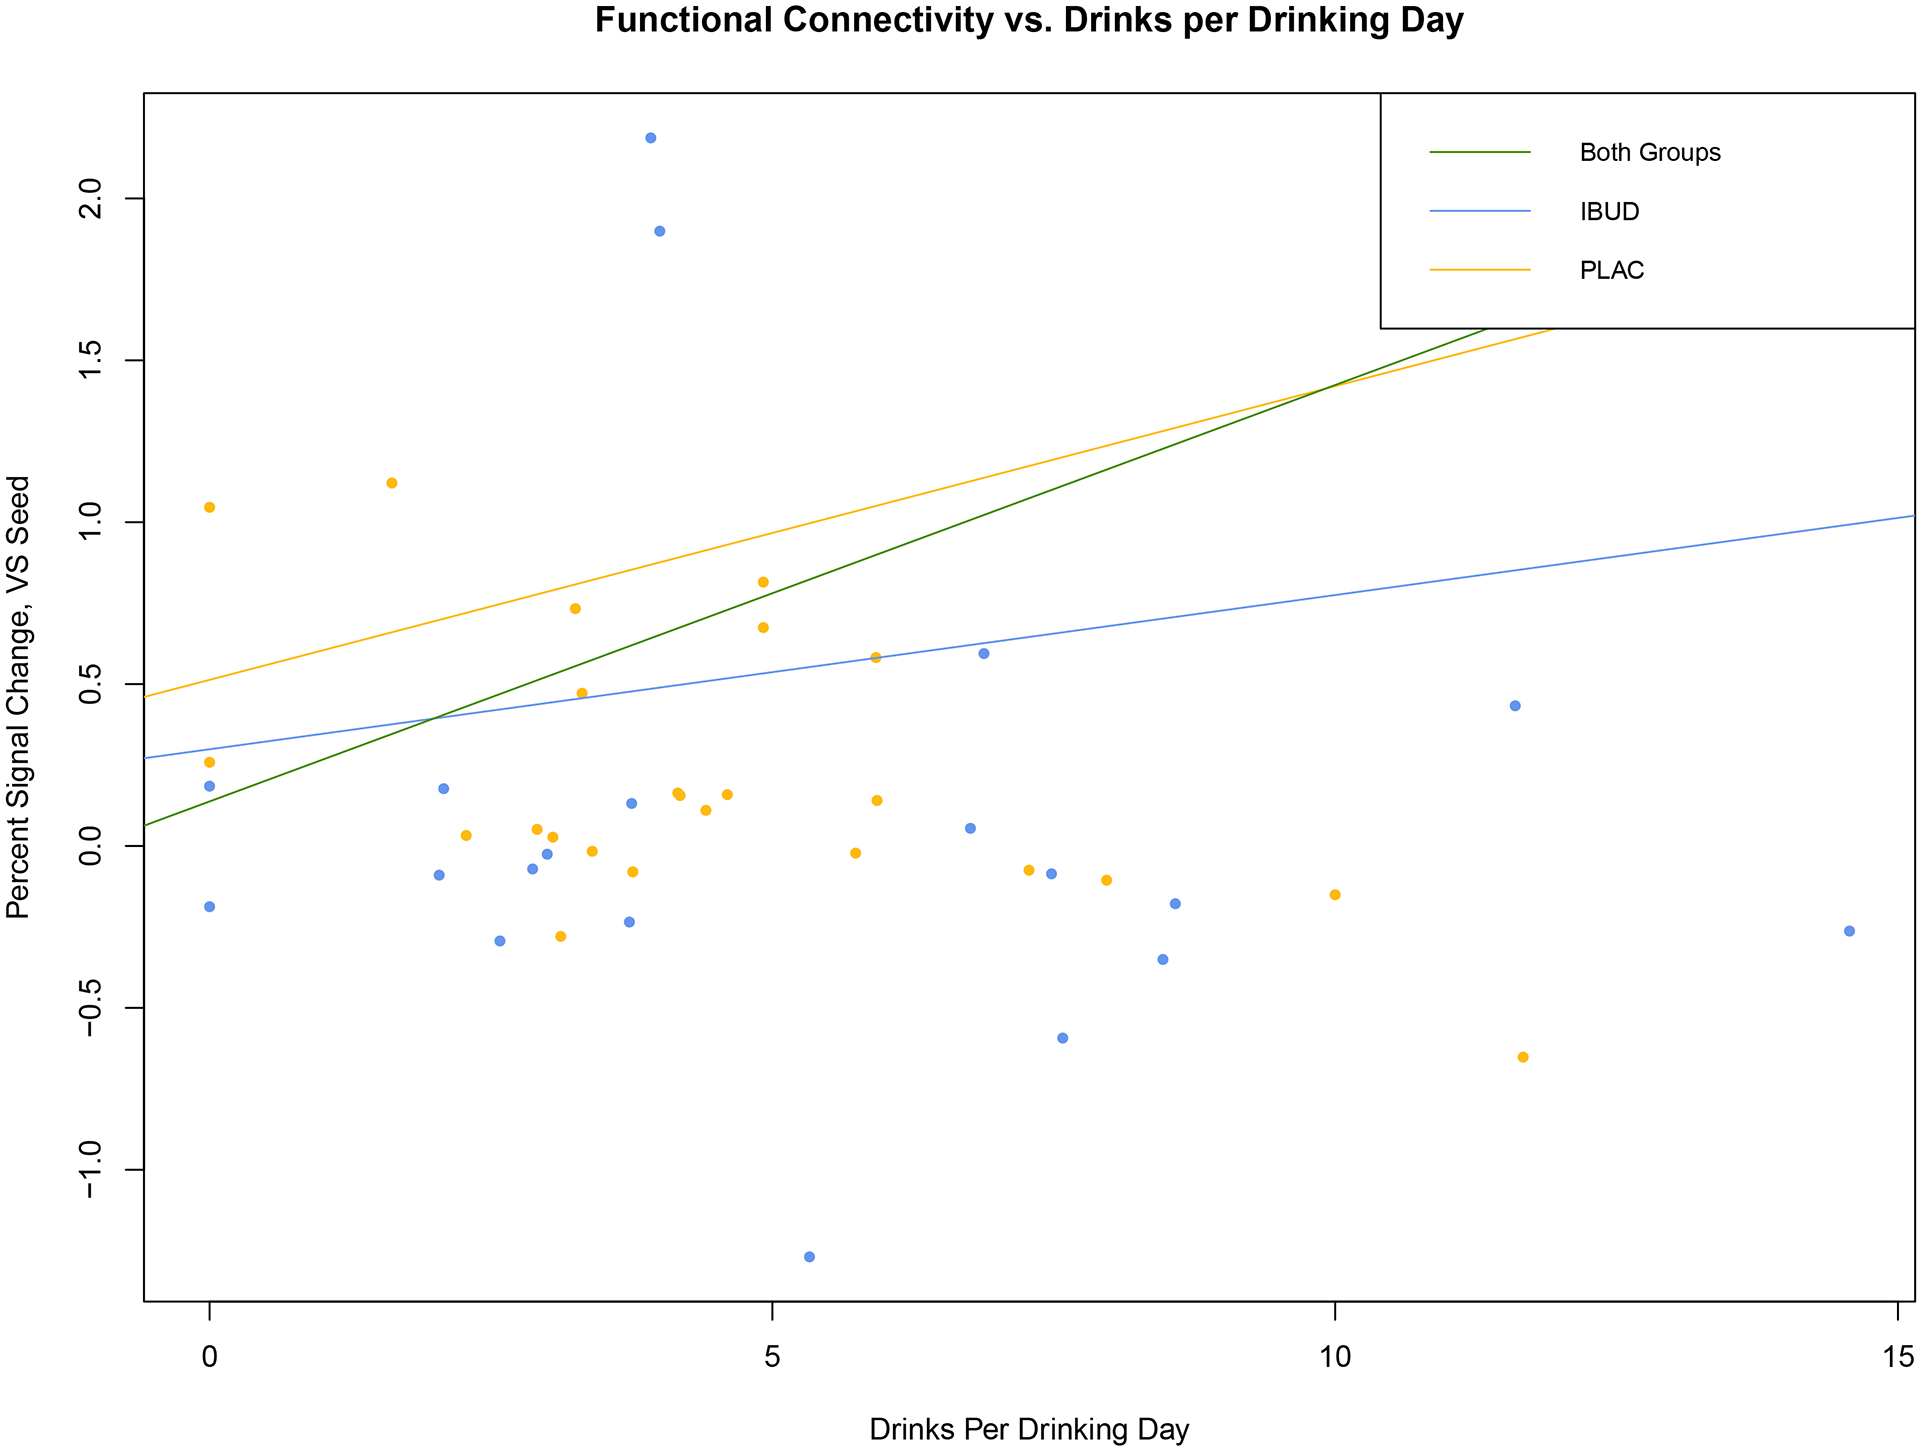
Activation profile (percent signal change) within clusters showing correlated activation from VS seed vs. Drinks per Drinking Day in the last week of the trial (controlling for baseline drinks per drinking day. Across groups (green): R2=0.5351, p<0.001; IBUD (blue): R2=0.09506, p>0.05: Placebo (yellow): R2=0.7363, p<0.001.