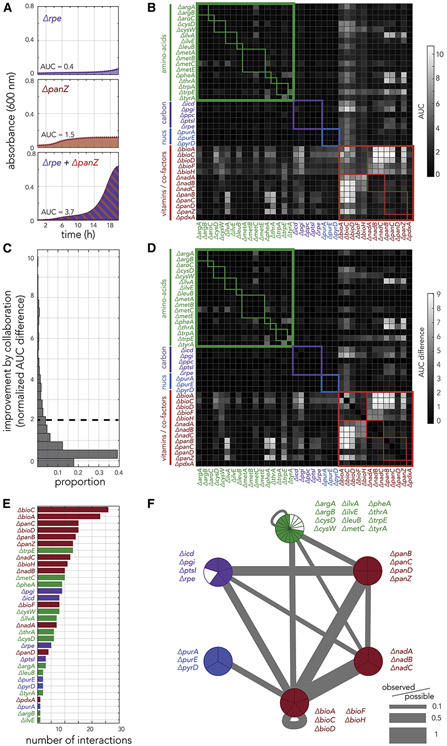
Figure 4. Fitness measurements in co-cultured strain pairs uncovers the underlying principles for pairwise cross-feeding.
(A) The panels show growth curves of rpe and panZ knockout strains inoculated individually or together as a co-culture. (B) The systematic measurement of fitness in co-cultured pairs reveals multiple instances of likely cross-feeding. The heatmap shows the area under the growth curve measured during 20 hours of growth across all 1,444 co-culture experiments. The thick colored frames mark similar biological function. The thin colored frames marks members belonging to the same biological pathway. (C) A histogram of all growth improvements calculated from pair co-culturing experiments. We used a cutoff of 2 to identify potent cross-feeding interactions that yield vigorous growth. (D) The growth improvement inferred across all co-culture experiments reveal that strains dysfunctional for vitamin and co-factor biosynthesis are potent collaborators (bright columns and rows). The heatmap shows the growth improvement calculated for all co-culture experiments. (E) The number of strong interactions each knockout strain participates in. (F) The network of cross-feeding interactions reveals the rules underlying potent collaborations. The graph shows a compacted version of the full interaction network (supplementary figure 6) after merging strains with a similar biological function into a single network node. The pie chart of each node shows how many strains from the node participate in potent cross-feeding interactions. The edge width marks the number of observed interactions between nodes normalized to total number of possible interactions given the number of strains in each of the two connected nodes.

