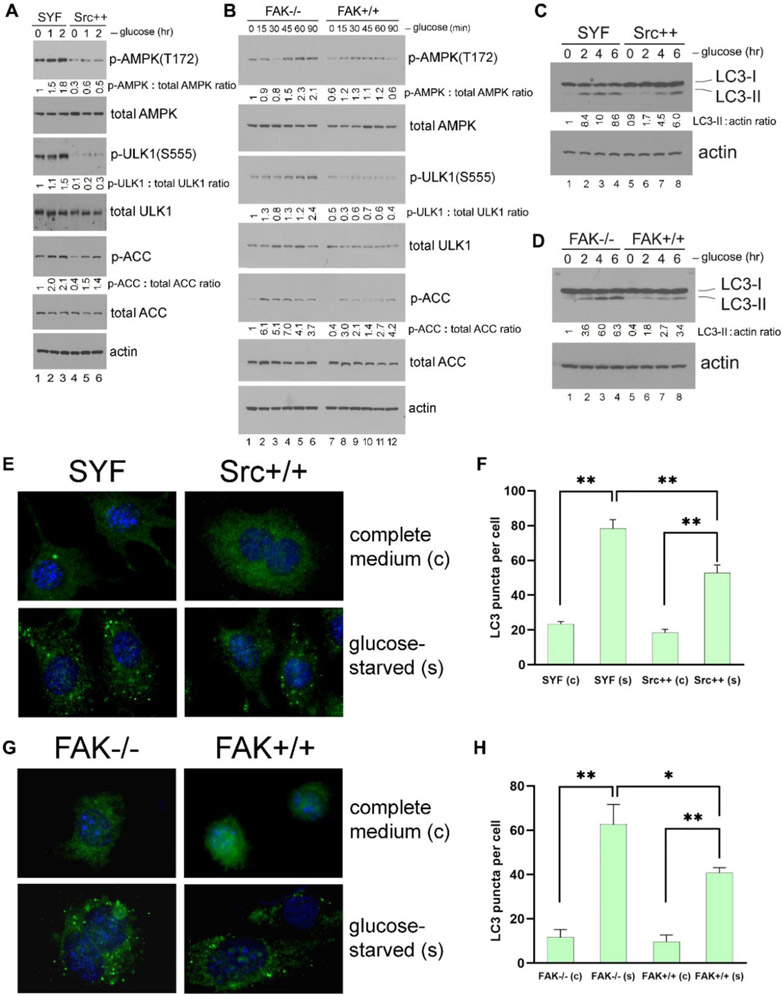
Figure 3. Src/FAK signaling suppresses glucose starvation-induced autophagy and AMPK activation.
(A and B) Glucose starvation of cells. SYF and Src++ MEFs (A), or FAK−/− and FAK+/+ MEFs (B) were cultured in DMEM plus 10% FCS without glucose for the indicated times, and the phosphorylation of AMPK and its downstream targets ULK1 and ACC were detected by immunoblot analysis of total cell lysates. Quantification was performed as in previous figures by using non-starved SYF and FAK−/− cells (lane 1 in each panel), respectively, as the normalized controls. In all panels for Fig. 3, results shown are representative of at least three independent experiments with similar results. (C and D) Induction of autophagy by glucose starvation. SYF and Src++ MEFs (C), or FAK−/− and FAK+/+ MEFs (D) were cultured in DMEM plus 10% FCS without glucose for the indicated times, and LC3-II formation was detected by immunoblot analysis. Quantification was performed by using non-starved SYF and FAK−/− cells (lane 1 in each panel) as the normalized controls, respectively. (E and G) Immunostaining of LC3. SYF and Src++ MEFs (E), or FAK−/− and FAK+/+ MEFs (G) cultured on coverslips were either kept in complete medium (“c”) or glucose-starved (“s”) for 2 hr, and the induction of autophagy was detected by immunofluorescence staining of LC3-II puncta. Quantification of LC3 puncta formation from (E) and (G) is shown in panels (F) and (H), respectively. Statistical analyses were performed using Student's t-test with Graphpad Prism software. *p <0.05 (n = 3), **p <0.01 (n = 3). For quantification and statistical analysis of the independent blots for Figs. 3A, B and C, please see Supplementary Figure 1.

