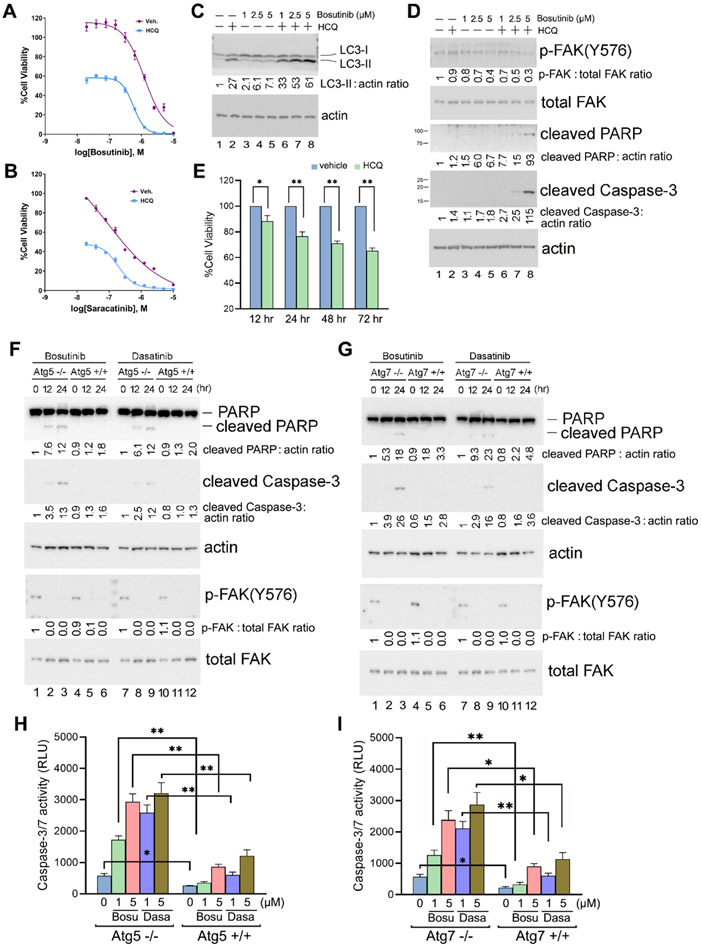
Figure 6. Synergistic cell killing effect of Hydroxychloroquine (HCQ) when combined with Src inhibitors.
(A and B) Cell viability assay. Py230 cells cultured in 384-well plates were treated with various concentrations of Src inhibitors Bosutinib (A) or Saracatinib (B) in the presence or absence of 20 μM of HCQ for 48 hr, and cell viability was determined using the CellTiter-Glo Luminescent Cell Viability Assay. The experiments were carried out independently three times in quadruplicate with means and standard deviations calculated with Microsoft Excel before graphing and analyses in GraphPad Prism. Values are normalized to vehicle control. Graphs are nonlinear regression fits of the means (variable slope (four parameters)), and error bars are standard deviations. * = p <0.01. (C and D) Immunoblot analysis of Py230 cells treated (+) or not (−) with 20 μM of HCQ and various concentrations of Bosutinib as indicated for 24 hr. Quantification of the immunoblots was performed as in previous figures by using untreated cells as the normalized control (lane 1). Results shown are representative of three independent experiments with similar results. (E) Py230 cells were kept in suspension and treated with or without 20 μM of HCQ for the indicated times, and cell viability was determined as in (A). The experiment was carried out independently three times in triplicate. (F and G) Immunoblot analysis of Atg5−/− and Atg5+/+ (F) and Atg7−/− and Atg7+/+ MEF cells (G) treated with 5 μM of Bosutinib or Dasatinib for the indicated times. Quantification of the immunoblots was performed as above by using the untreated knock-out cells as the normalized control in each case (lanes 1 and 7). Results shown are representative of three independent experiments with similar results. (H and I) Caspase 3/7 activity assay. Atg5−/− and Atg5+/+ (H), and Atg7−/− and Atg7+/+ MEF cells (I) were treated with 1 or 5 μM of Bosutinib or Dasatinib for 24 hr before Caspase-Glo® 3/7 Assay reagent (Promega Inc.) was added to each well and incubated at room temperature for 30 mins as per manufacturer’s instructions. Sample luminescence intensity was measured and reflected by the number of relative light units (RLU). Data are presented as the mean ± SD, n = 3. * = p <0.01, ** = p <0.001. For quantification and statistical analysis of the independent blots for Figs. 6C, D, F and G, please see Supplementary Figure 1.

