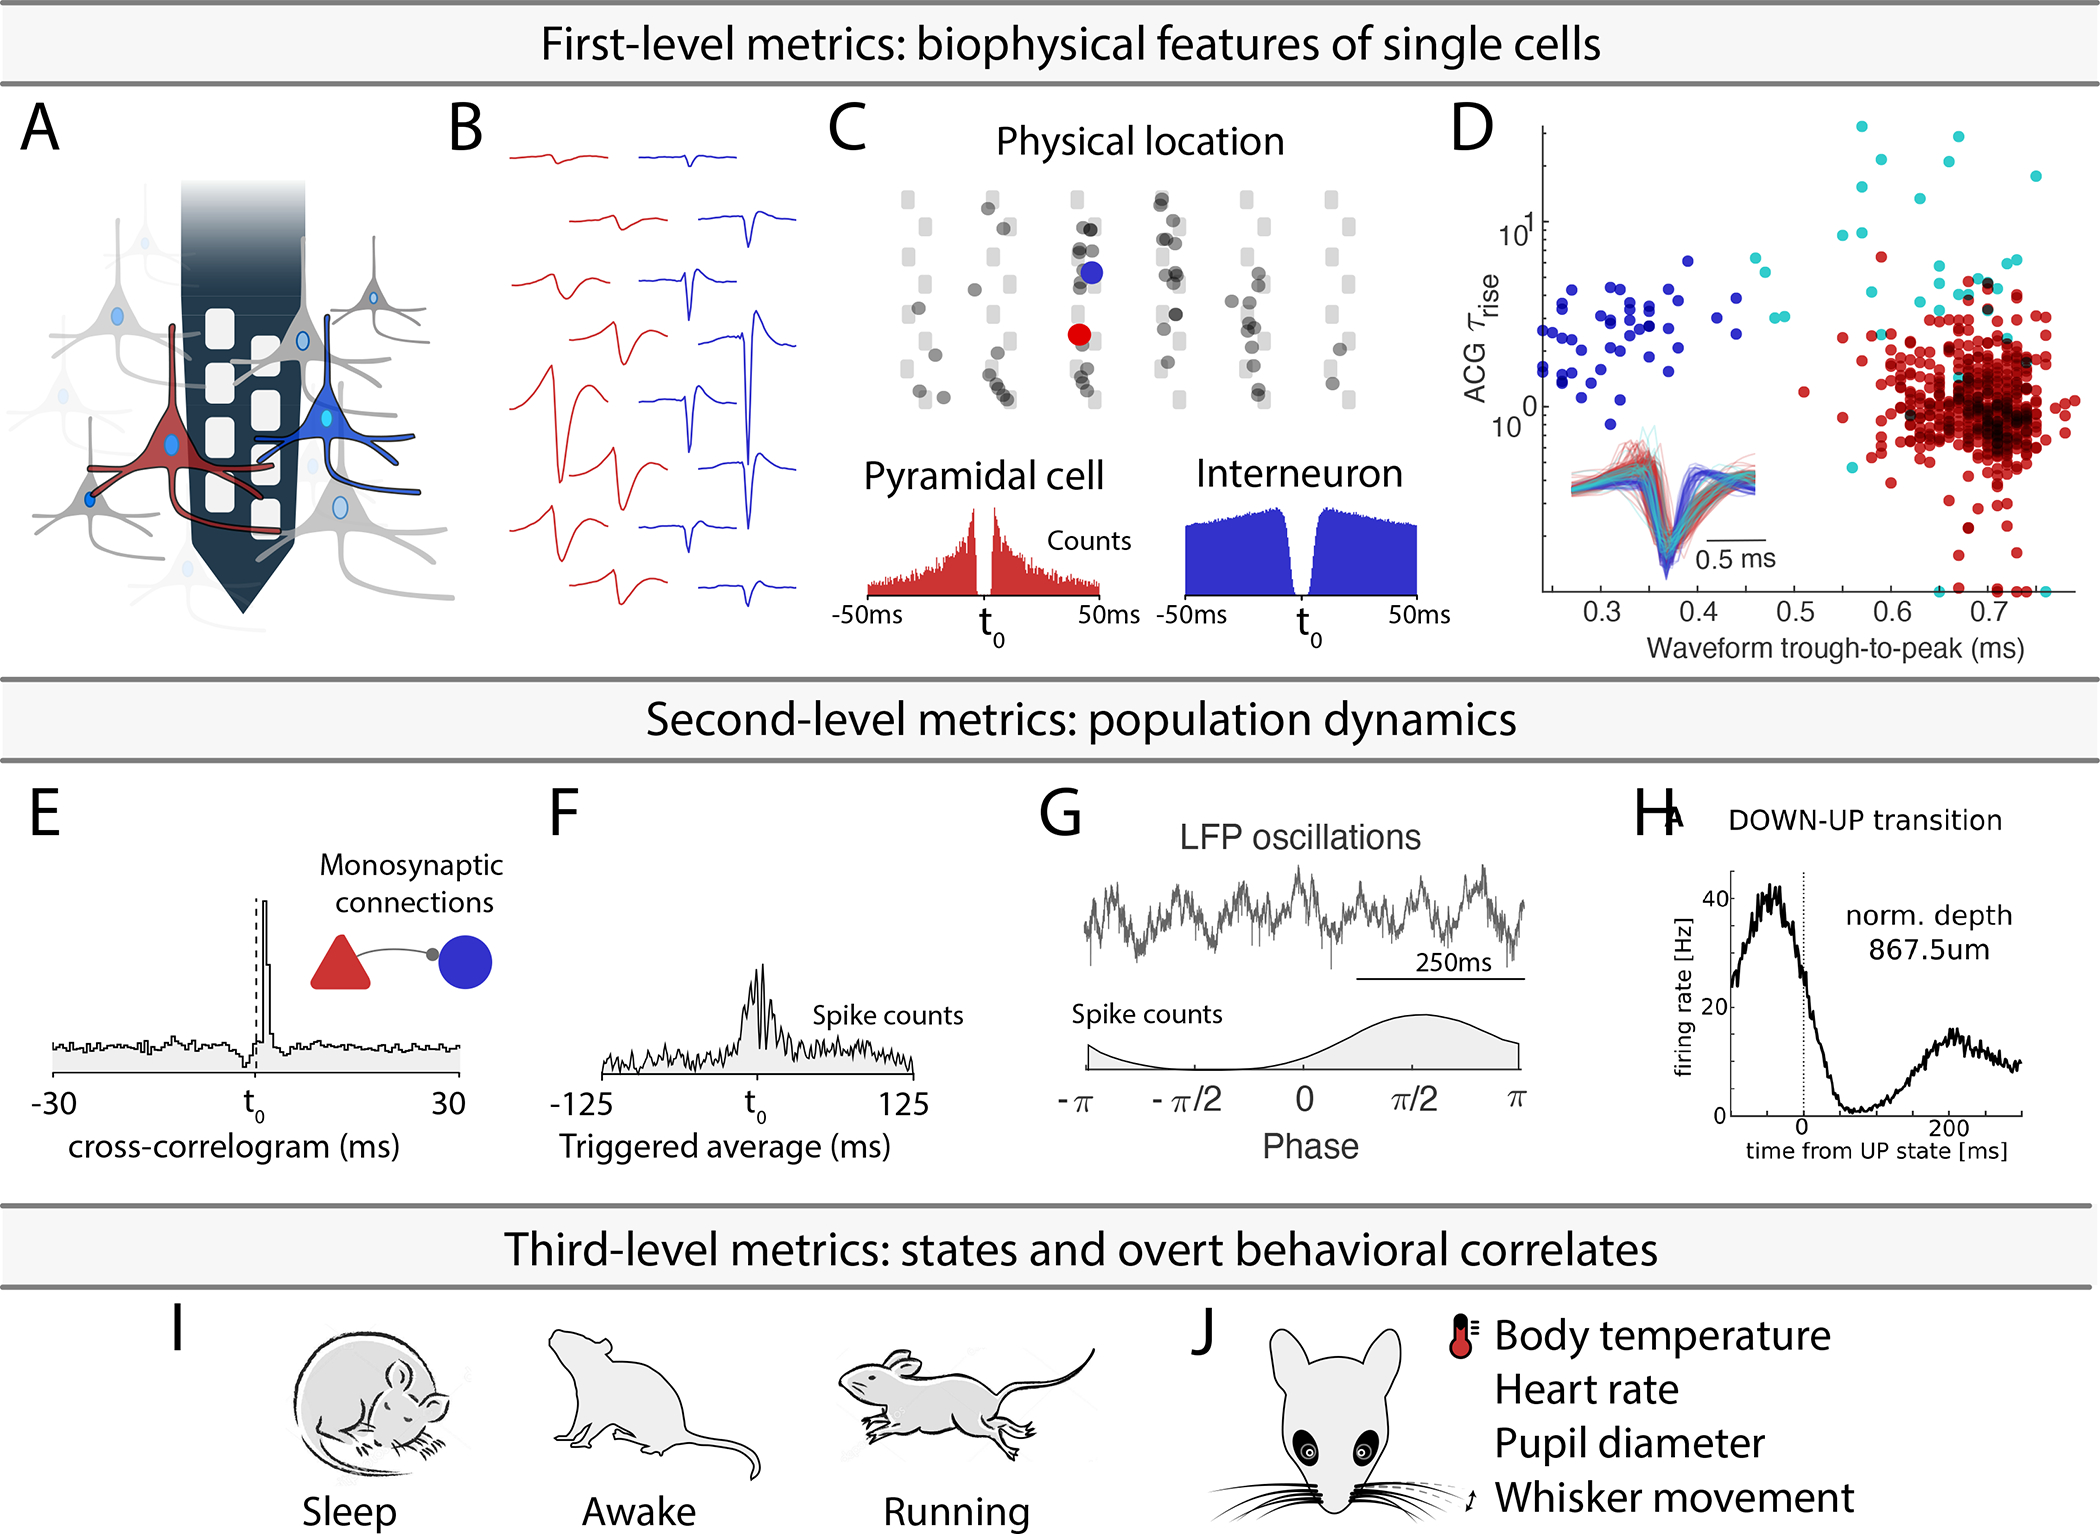
Figure 1: Experimental paradigm-independent characterization of single neurons.

A. Using high-density silicon probes or multiple tetrodes (shown is a single shank with 8 recording sites), dozens to hundreds of neurons can be recorded simultaneously. B. Spikes of putative single neurons are extracted from the recorded traces and assigned to individual neurons through spike sorting algorithms. C. Their relative position determined through trilateration (the top panel shows neurons projected on a silicon probe with 6 shanks and a staggered electrode layout). Autocorrelograms (ACGs; lower two panels) are used to characterize the neurons (a bursting pyramidal cell with a wide waveform in red; a fast spiking interneuron with a narrow waveform in blue). D. Neuron-type classification based on first-order biophysical parameters, such as spike waveform width (trough-to-peak) and the temporal scale of the rising phase of the ACGs (τrise). Optogenetic and other direct identification methods can further ground units to neuron types. E. Interactions between neurons are characterized by their cross-correlograms and monosynaptic connections (determined via spike transmission probabilities). F. Event related histogram. G. Relating spikes to LFP patterns. H. Relating spikes to brain state changes. I-J. Spike pattern correlations with brain states and overt behaviors. Only a few possible examples are shown. See also Supplementary Table 1.
