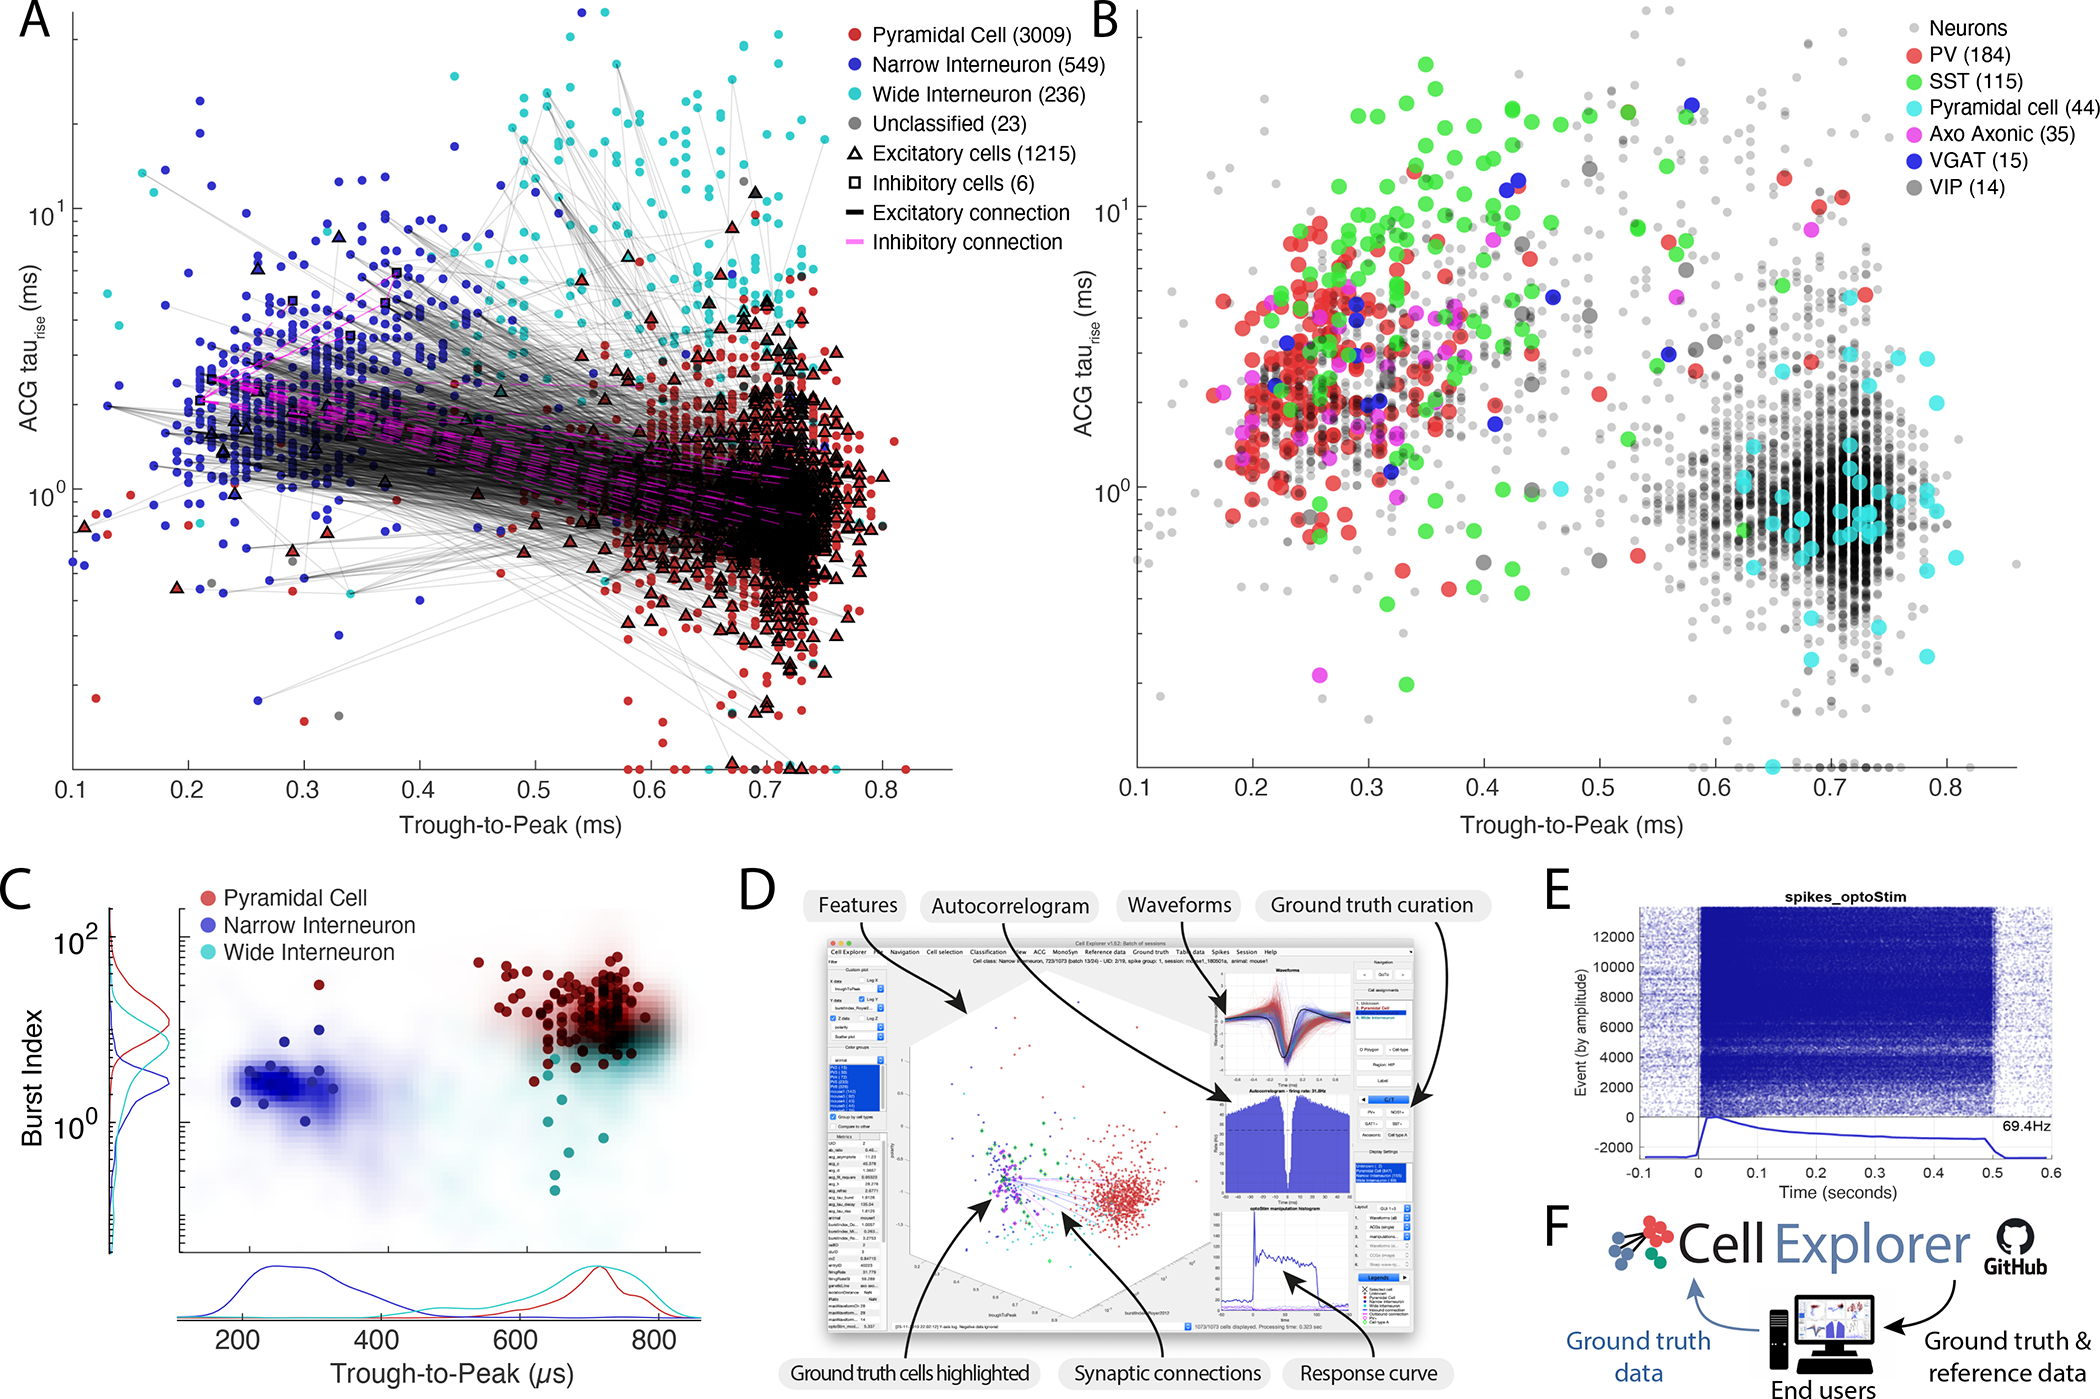
Figure 5. Community-based collaborations allow for improved single neuron characterization.

A. Distribution of putative cell types (3657 cells), including their projections determined via spike-transmissions CCG curves (Petersen and Buzsáki, 2020; Petersen et al., 2020) Excitatory and inhibitory cells determined from monosynaptic connections are highlighted with black triangles and magenta squares respectively. The marginal distributions are shown both as counts and probability distributions. B. Example ACGs for the three cell types and the ACG fit (black line). C. Top row: Average peak-normalized ACGs of the three cell types. bottom row: Average waveform for the three cell types (z-scored). D. t-SNE representation of the same cell population. E. Lower two panels: agglomerative clusters of data with 2 (left panel) and 3 clusters (right panel). F. 407 optogenetically identified neurons, including PV (184), SST (115), pyramidal cells (44), axo-axonic (35), VGAT (15) and VIP cells (14) projected onto the same population of neurons as in A (Sources: Allen Institute and Buzsáki lab; English et al., 2017; Senzai et al., 2019; Siegle et al., 2021). G. Isolation distance in cluster space for the population shown in A and I. See also Supplementary Figure 7 and 8.
