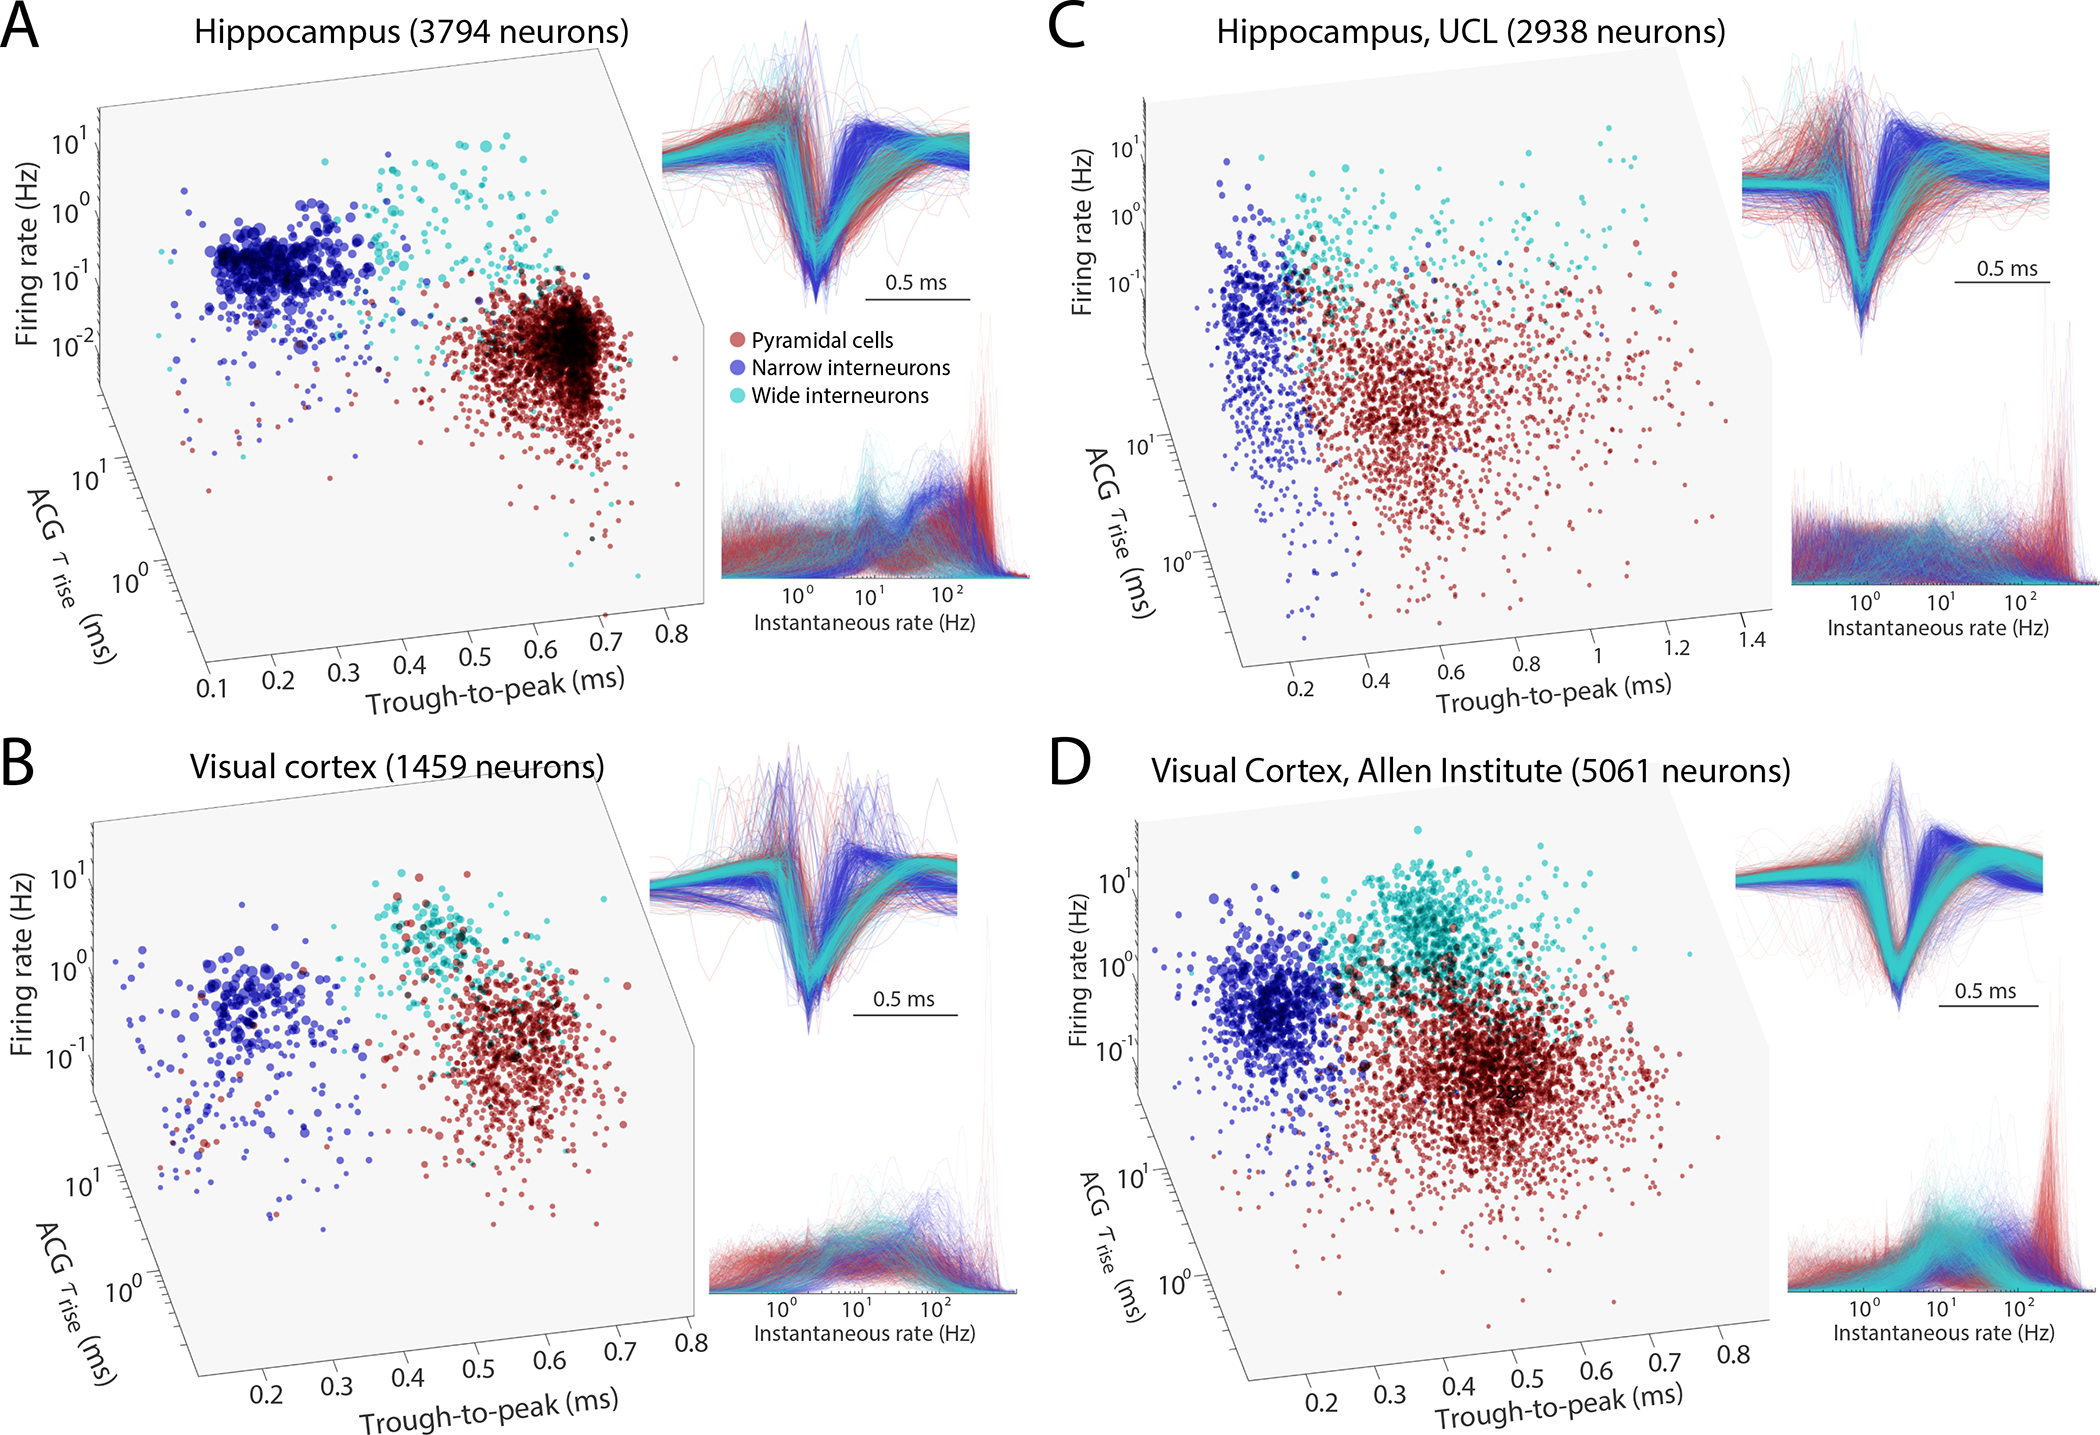
Figure 6. Comparison of initial neuron classification by CellExplorer on large scale datasets from three different laboratories.

A. Data from hippocampus (Petersen and Buzsáki, 2020). B. Data from visual cortex (Senzai et al., 2019). C. Hippocampal and visual neurons selected from the UCL dataset (Steinmetz et al., 2019). D. Visual cortex cells from the Allen Institute (Siegle et al., 2021). Right panels across A-D: Z-scored waveforms across all neurons (top) and distribution of instantaneous rates (1/interspike intervals) across all neurons. A and B are based on long home cage (sleep) data (several hours), while C and D data are from short (~ 30 min) sessions in head-fixed, task-performing mice. See also Suppl. Fig. 8. Red, pyramidal cells; Blue, narrow waveform interneurons; Cyan, wide waveform interneurons.
