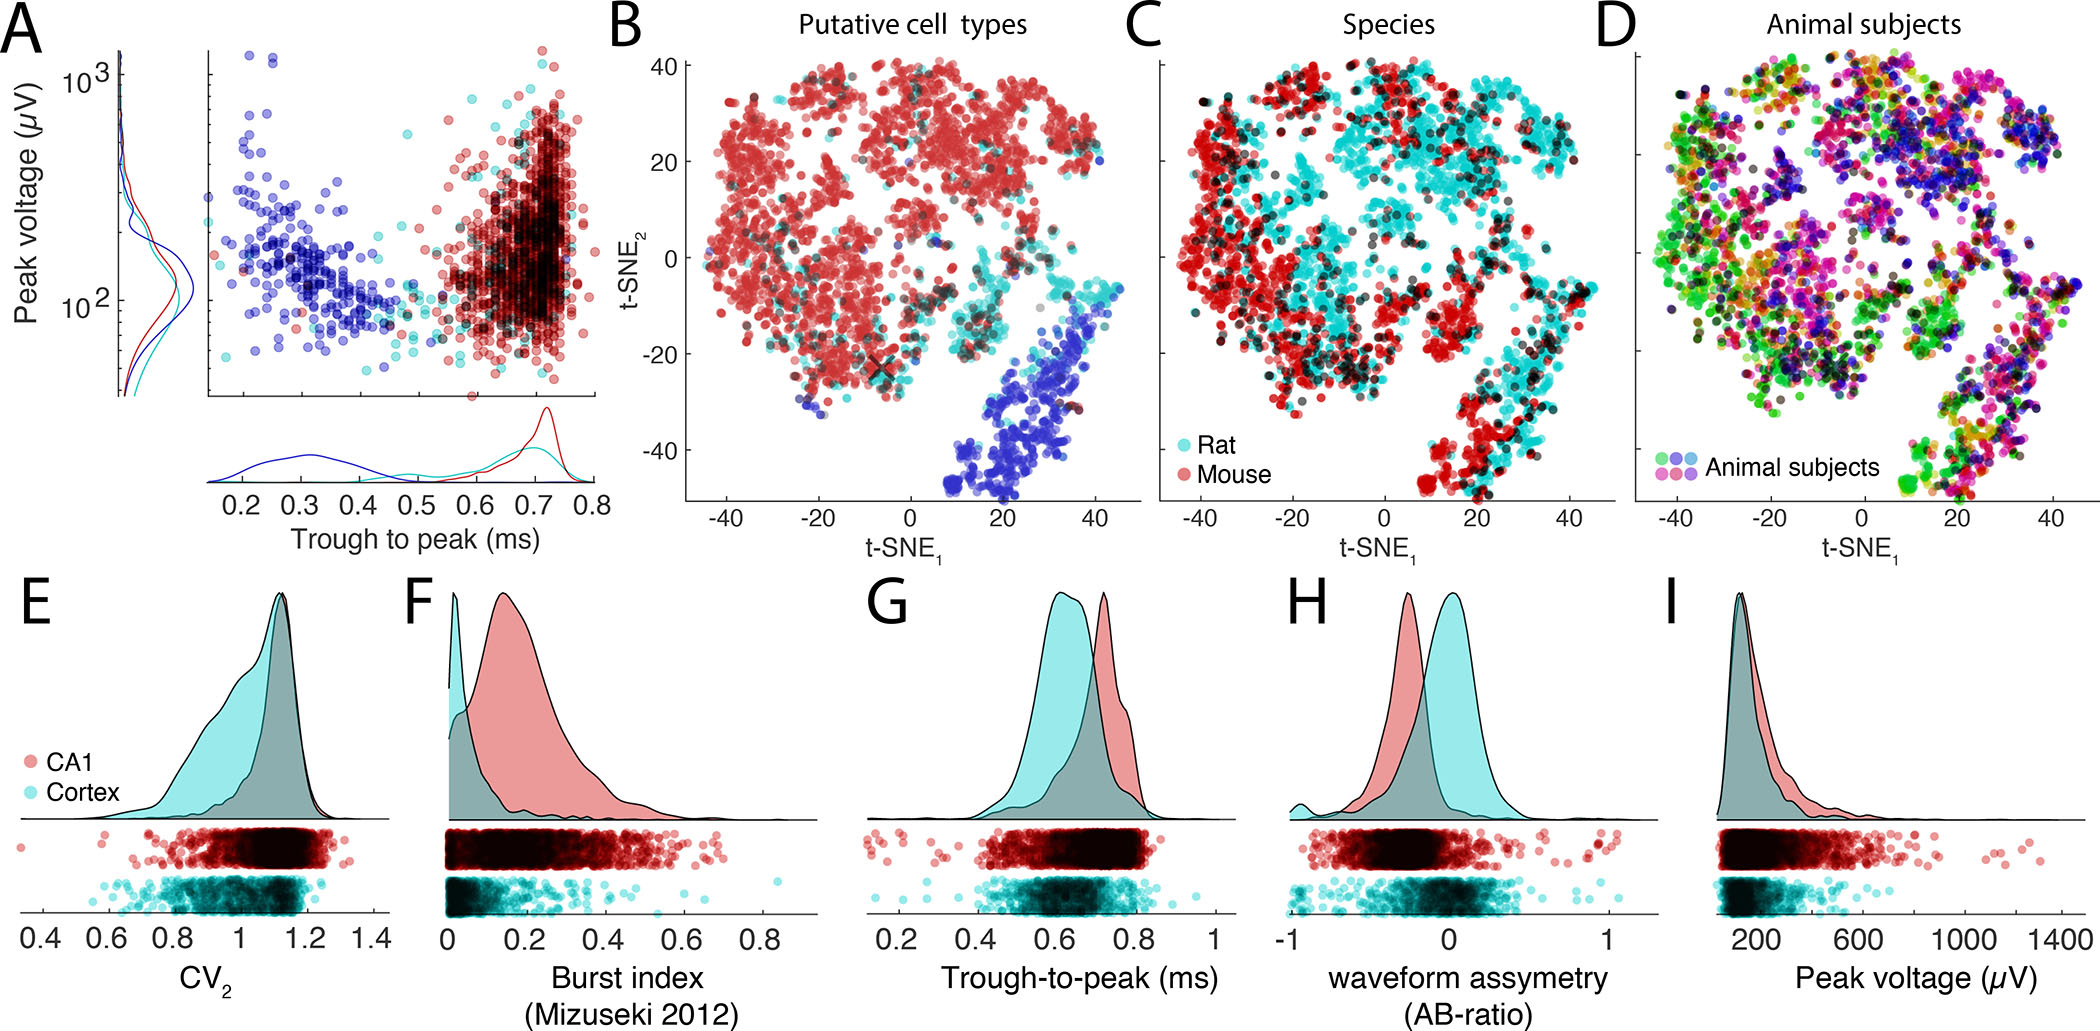
Figure 8. Exploration and comparison of metrics and cells across, species, subjects and brain regions.

A. Distributions of spike amplitudes and waveform width (quantified by the trough to peak metrics) for the three groups from multiple CA1 datasets. Note inverse relationship between spike amplitude and waveform for putative interneurons. B-D. t-SNE representations of putative cell types (B), species (C, rat, and mouse in magenta and red, respectively) and subjects (D, colors scaled across subjects) for hippocampal neurons. E-I: Comparison of spike features of neurons recorded from CA1 pyramidal cells and visual cortex pyramidal cells. Significant differences are observed across several basic metrics, including CV2 (E), burst index (F), trough-to-peak (G), waveform asymmetry (H), and waveform peak voltage (I).
