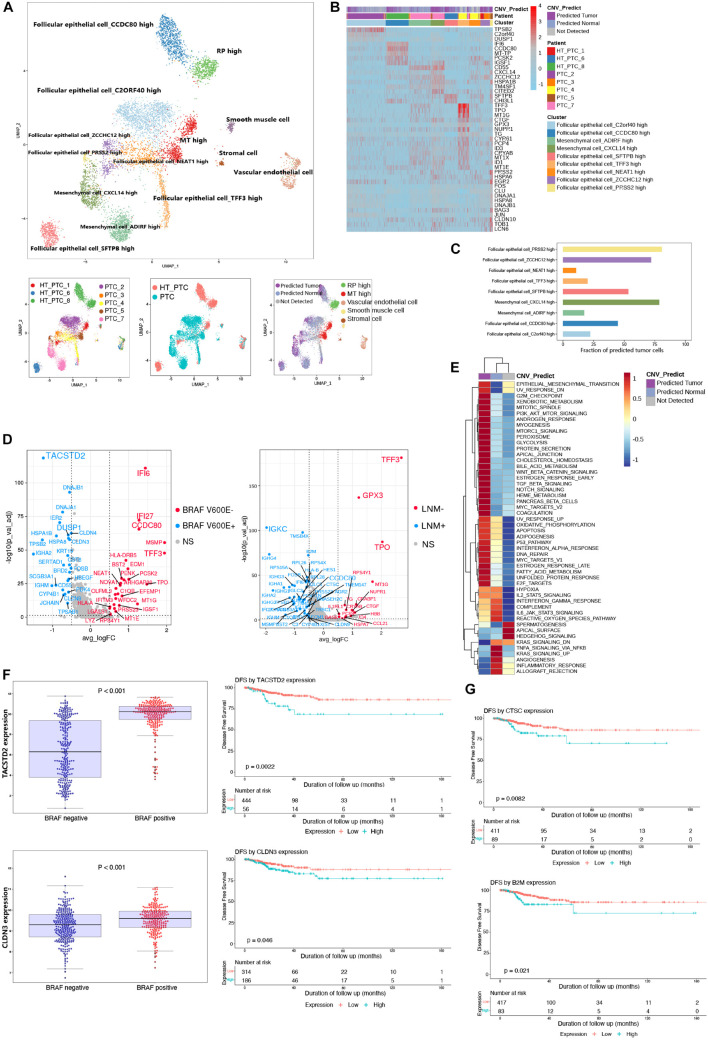
FIGURE 2.
Reclustering of parenchymal cells and identification of malignant cells. (A) UMAP plot of parenchymal cell subclusters colored by cell types, patients, PTC types, and CNV prediction. (B) Heatmap shows the DEGs of clusters, patients, and CNV groups. PTC, samples from PTC patients without concurrent HT; HT_PTC, samples from PTC patients with concurrent HT. (C) Fractions of predicted tumor cells in each cell subcluster. (D) Volcano plots show DEGs of follicular epithelial cells based on BRAF V600E mutation and LNM. BRAF V600E+, highly expressed genes in patients with BRAF V600E mutation; BRAF V600E–, highly expressed genes in patients without BRAF V600E mutation; LNM+, highly expressed genes in patients with LNM; LNM-, highly expressed genes in patients without LNM; NS, genes with no significant expression patterns. (E) GSVA pathway enrichment of different group based on CNV level. (F) Expression level of TACSTD2 and CLDN3 between different mutation groups and DFS analysis in the TCGA-THCA cohort. (G) DFS analysis of CTSC and B2M in the TCGA-THCA cohort.

