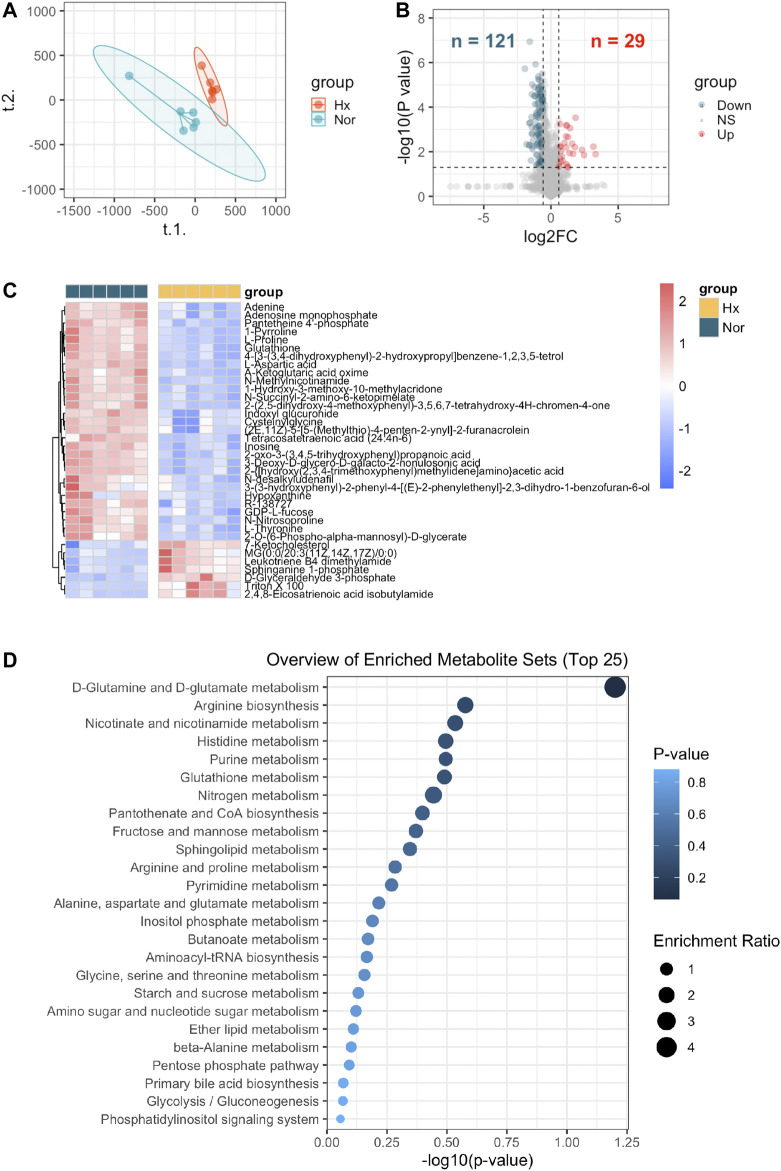
FIGURE 2.
Identification of metabolites distinguishing rat PASMCs under hypoxia from normoxic controls and enriched metabolite sets. (A) Partial least squares discriminant analysis (PLS-DA) demonstrated a well separated sample distribution of rat PASMCs under hypoxia (Hx) and control PASMCs (Nor) for 24 h and visualized in scatter plot (n = 6). (B) 29 upregulated metabolites (red dots) and 121 down-regulated metabolites (dark green) were identified and visualized in volcano plot (Fold change >1.5 or <0.67 and p < 0.05). (C) Expression of distinguishing metabolites in (B) with VIP score >1 were visualized in heatmap. (D) Top 25 enrichment metabolite sets of distinguishing metabolites were identified in Metaboanalyst (v 5.0).

