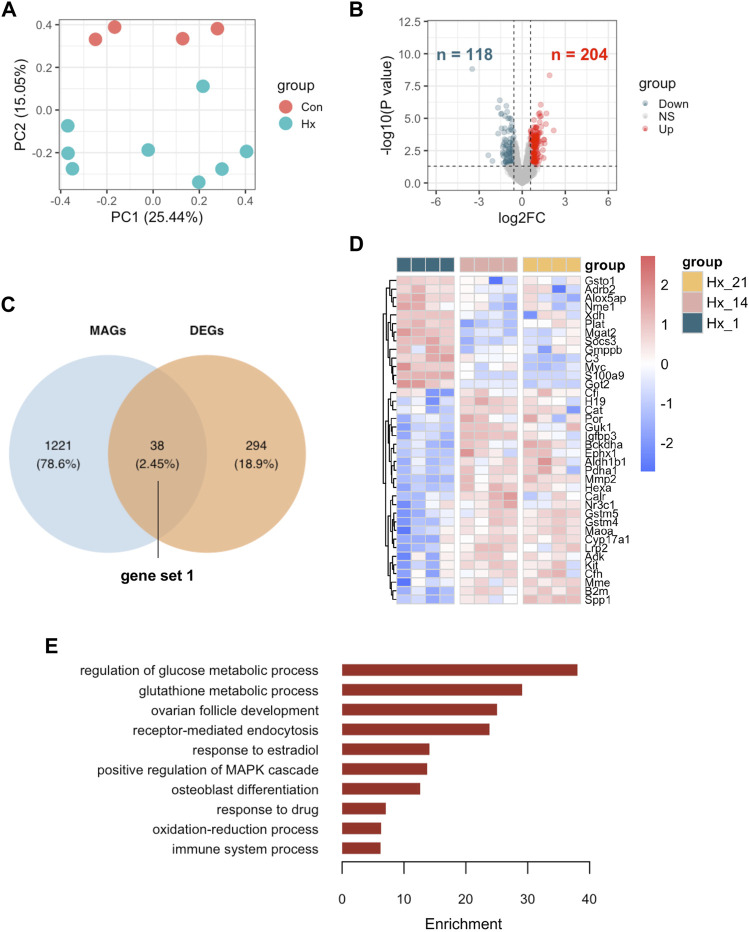
FIGURE 3.
Identification of metabolism associated DEGs in mouse lungs of hypoxia induced PH and enriched pathways. (A) Principal component analysis (PCA) demonstrated a well separated sample distribution of mouse lung tissues of hypoxia at day 14 and at day 21 (Hx) and those of hypoxia at day 1 (Con) from GSE 1909 (n = 4 per condition). (B) 204 upregulated genes (red dots) and 118 down-regulated metabolites (dark green) were identified and visualized in volcano plot (Fold change >1.5 or <0.67 and p < 0.05).(C) Overlap of metabolism associated genes (MAGs) and DEGs between Hx and Con were visualized in Venn diagram; 38 overlapped genes was listed as gene set 1. (D) Expression of 38 overlapped genes were visualized in heatmap at indicated time point after hypoxia; Hx_21: day 21 after hypoxia; Hx_14: day 14 after hypoxia; Hx_1: day 1 after hypoxia. (E) The enriched GO ontology (biological process) were identified by functional annotation tool DAVID and visualized in bar plot.

