FIGURE 6.
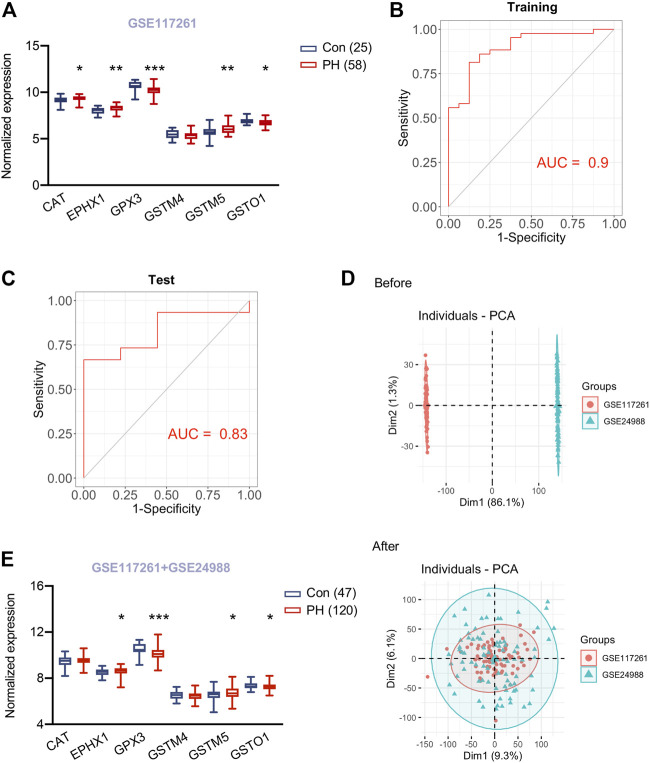
Validation of hub genes in lungs of PH patients and a predicting model for PH. (A) Expression of six hypoxia induced metabolism associated hub genes in lung tissues of 58 patients with pulmonary hypertension (PH) and 25 control subjects from GSE117261. (B) ROC curve analysis of training set (GSE117261) using six hub genes. (C) ROC curve analysis of test set (GSE117261) using six hub genes. (D) PCA analysis demonstrated the distribution of data sets GSE117261 (red) and GSE24988 (green) before (upper panel) and after (lower panel) removal of batch effect. The distribution was visualized in scatter plot. (E) Expression of six hypoxia induced metabolism associated hub genes in lung tissues of 120 patients with pulmonary hypertension (PH) and 47 control subjects from GSE117261 and GSE24988 after correction of batch effect. Data represent mean ± SEM. *p < 0.05, **p < 0.01, ***p < 0.001 compared to corresponding control subjects, as analyzed by unpaired t test or Mann-Whitney U test respectively, as appropriate.

