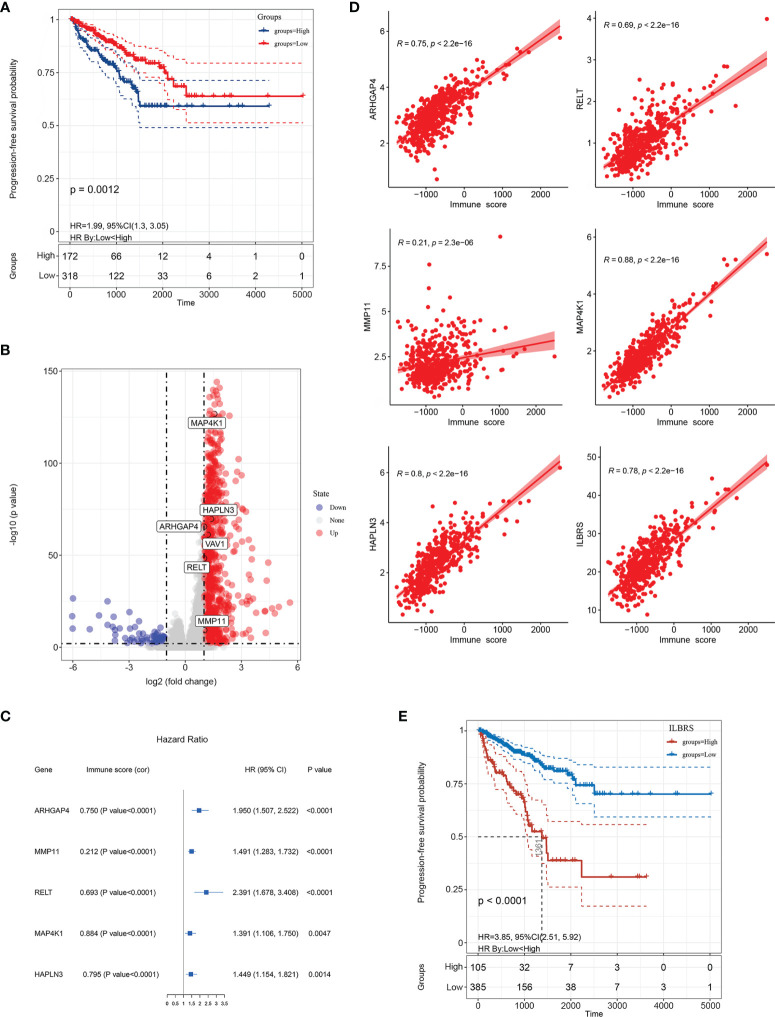
Figure 2.
Establishment of immune landscape-based risk score (ILBRS). (A) Kaplan–Meier curves for high and low immune score patient groups in TCGA-PRAD data. (B) Volcano plot of immune landscape-based DEGs (IL-DEGs). (C) Forest plot of the results of univariate Cox regression analyses of IL-DEGs included in the ILBRS formula. The square data markers indicate the estimated hazard ratios (HRs). Error bars represent 95% confidence intervals (CIs). “cor” indicates the coefficient gained through Pearson correlation analysis. (D) Pearson correlation analysis of ILBRS and its variables with immune scores. (E) Kaplan–Meier curves for high and low ILBRS patient groups in TCGA-PRAD data.

