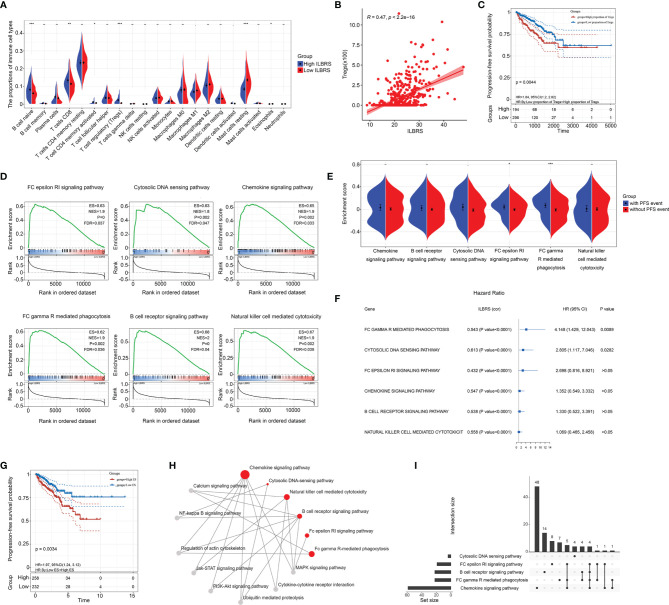
Figure 3.
ILBRS-relevant immune cell infiltration and immune-relevant KEGG pathways. (A) The proportions of 22 immune cell types in high and low ILBRS patient groups in TCGA-PRAD data. (B) Pearson correlation analysis of ILBRS and Tregs infiltration. (C) Kaplan–Meier curves for the PCa tissues from patients with high and low Tregs infiltration in TCGA-PRAD data. (D) KEGG pathway analyses show a notable pathway of the gene signature. (E) PFS event risk assessment for the ES of the immune-relevant KEGG pathways. (F) Forest plot of the results of univariate Cox regression analyses of the ES of the immune-relevant KEGG pathways. The square data markers indicate estimated hazard ratios (HR). The error bars represent 95% CIs. “cor” shows the coefficient gained through Pearson correlation analysis. (G) Kaplan–Meier curves for the PCa tissues from patients with high and low ES of FC gamma R-mediated phagocytosis in TCGA-PRAD data. (H) The immune-relevant KEGG pathway network. The red dots represent the six pathways. The gray dots are the intermediate pathways between two of the immune-relevant KEGG pathways. (I) Venn plot presenting overlapped genes among the immune-relevant KEGG pathways. *p < 0.05; **p < 0.01; ***p < 0.0001.

