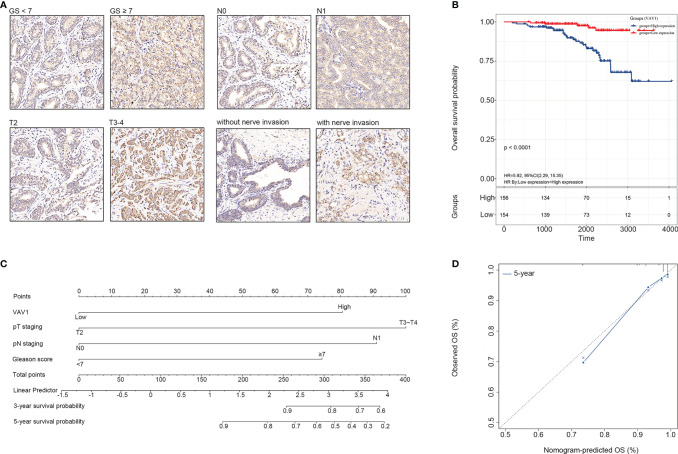
Figure 5.
Experimental verification of VAV1 in PCa tissue microarray (TMA). (A) The protein expression and localization of VAV1 in PCa TMA. (B) Kaplan–Meier curves for the PCa tissues from patients with high and low expression of VAV1 in TMA data. (C) Nomogram integrating VAV1, GS, and pTNM to predict the probability of 3- and 5-year OS for PCa patients in TMA data. (D) The calibration curve shows that the nomogram model has a better predictive effect on the 5-year OS of PCa patients in TMA data.

