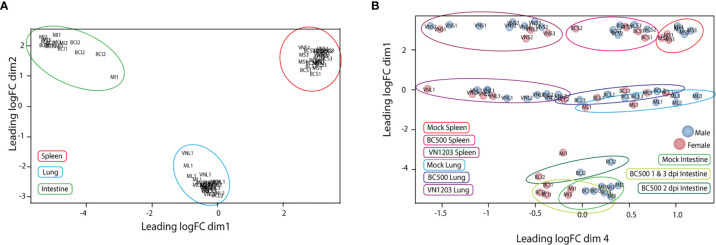
Figure 1.
Multidimensional scaling (MDS) plot of normalized individual RNA-sequencing experiments. MDS plots were made in the EdgeR program comparing the top 200 logFC results between each sample. Individual samples and their relative similarity and differences were compared using dimensions 1 and 2 (A) and dimensions 1 and 4 (B). Individual plot points were named by treatment (VN, VN1203; BC, BC500 and M, Mock), tissue (L, Lung; S, Spleen and I, intestine) and dpi (1, 2 and 3). Ex: Spleen from mock treated duck 1 dpi = MS1. Individual male ducks are identified by a blue dot and females by a red dot.

