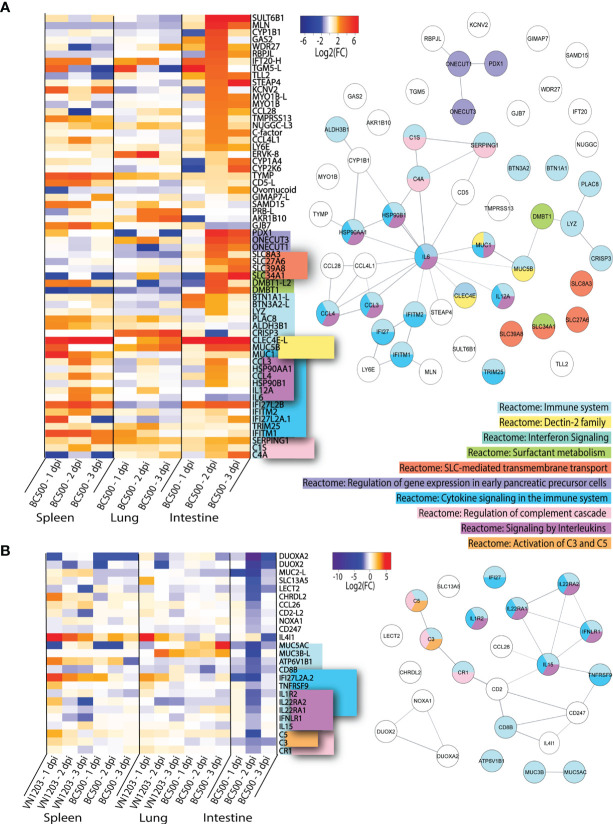
Figure 6.
Genes up or downregulated following BC500 infection of ducks. Lists of statistically significant (FDR<0.05) genes were compared for similarity in expression (Log2(FC)>1.5) and clustered together if they were uniquely upregulated in at least 2 out of 3 tissues in BC500 infected ducks (A). Lists of statistically significant (FDR<0.05) downregulated (Log2(FC)<-1) in intestine of BC500 ducks were compared to other tissues of both VN1203 and BC500 infected ducks to determine uniquely downregulated genes in intestine (B). STRING diagrams depict predicted protein-protein interactions between the products of each gene, while colour coding is based on term enrichment of Reactome pathways. No colour means that the genes did not enrich any of the Reactome terms. Reactome terms were considered significant if FDR<0.05. Enrichment and STRING diagram was created using the STRINGTIE app in Cytoscape.

