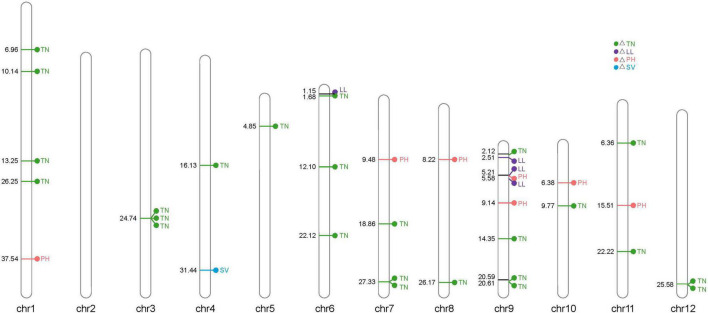
FIGURE 5.
Distribution of 56 significantly associated single-nucleotide polymorphisms (SNPs) on 12 chromosomes based on the physical distance from the four NUE-related agronomic trait differences. The numbers on the left side of each column represent the physical location (Mb) of each lead SNP. Letters to the right of each column represent the corresponding traits of △SV, △LL, △PH, and △TN.

