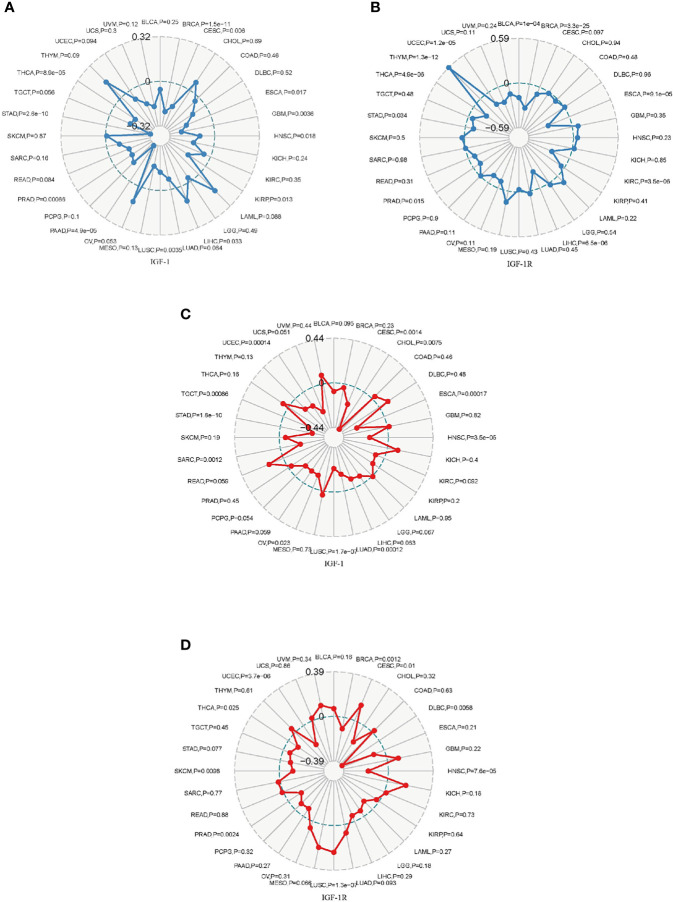
Figure 7.
Radar map plotting the correlation of tumor mutation burden (TMB) (A) and microsatellite instability (MSI) (B) with IGF-1 expression across 33 cancer types. Radar map plotting the correlation of tumor mutation burden (TMB) (C) and microsatellite instability (MSI) (D) with IGF-1R expression across 33 cancer types.

