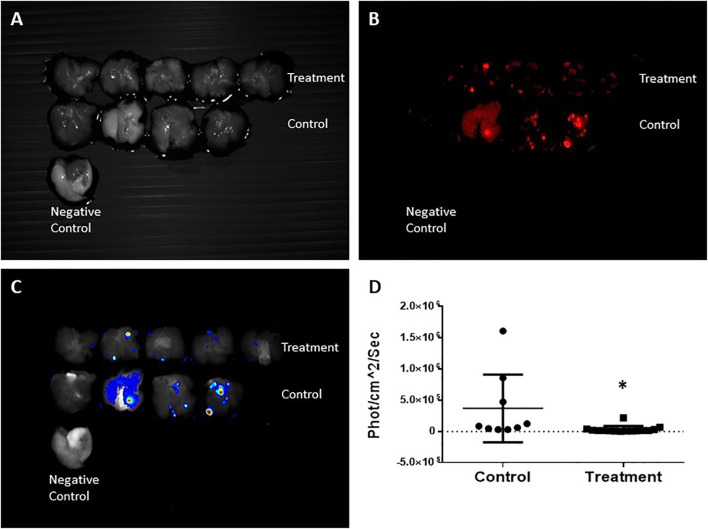
Figure 7.
CRi Maestro fluorescent ex-vivo imaging of the lungs. (A) Lungs – grayscale. (B) Fluorescent imaging of mCherry metastases. (C) Heat map of viable metastases. (D) Quantitation of total fluorescent signal in the lungs per group, expressed in x106phot/cm2/sec. Each dot represents the fluorescence intensity of individual metastases. Normal lungs without mCherry expression were used as a negative control. Each pair of lungs may contain several metastases that express different fluorescence intensities. Results are representative of 3 different experiments. *Statistically significant difference.

