Figure 5.
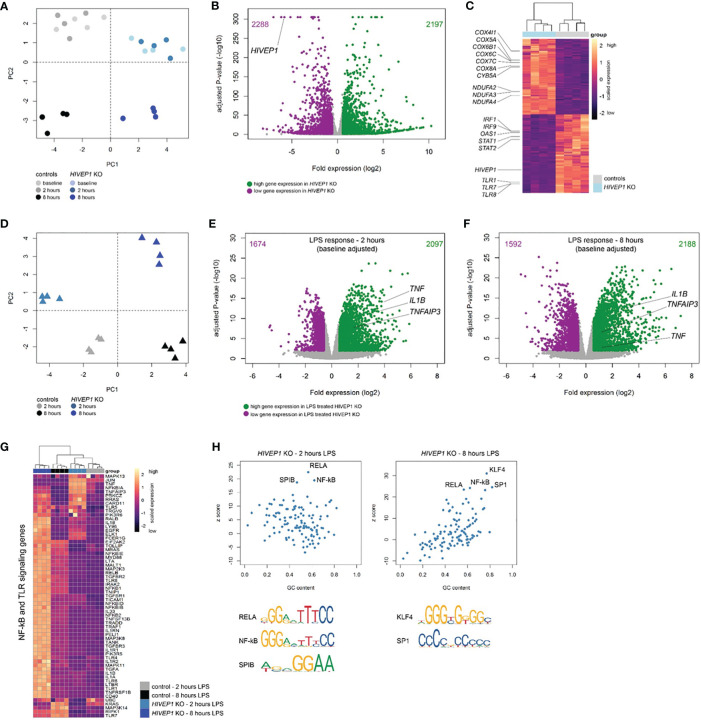
RNA-sequencing of HIVEP1 deficient THP-1 cells before and after LPS stimulation. (A) Principal component plot of 30,013 genes per sample showing clustering of HIVEP1 deficient cells and controls at baseline and after 2 and 8 hours culturing in medium. (B) Volcano plot depicting genome-wide changes in gene expression of HIVEP1 deficient cells relative to controls at baseline. Green dots denote high expression genes (Benjamini-Hochberg (BH) adjusted p < 0.01 and fold change ≥ 1.5); purple dots depict low expression genes (BH adjusted p < 0.01 and fold change ≤ -1.5). (C) Unsupervised heatmap plot of 4485 significantly altered genes at baseline illustrating genes involved in oxidative phosphorylation, interferon signaling and pattern recognition receptors. (D) Principal component plot (30,013 genes) of LPS-treated (2 and 8 hours) HIVEP1 deficient cells and controls showing clear clustering. (E) Volcano plot depicting genome-wide changes in LPS-induced gene expression (corrected for baseline differences) of HIVEP1 deficient cells relative to controls at 2 hours. (F) Volcano plot illustrating transcriptomic differences in LPS-induced gene expression (baseline corrected) of HIVEP1 deficient cells relative to controls at 8 hours. (G) Heatmap representation of genes involved in Toll-like receptor and NF-kB signaling in LPS-treated samples. (H) Dot plots depicting z-scores against GC content of transcription factor binding site enrichment analysis.

