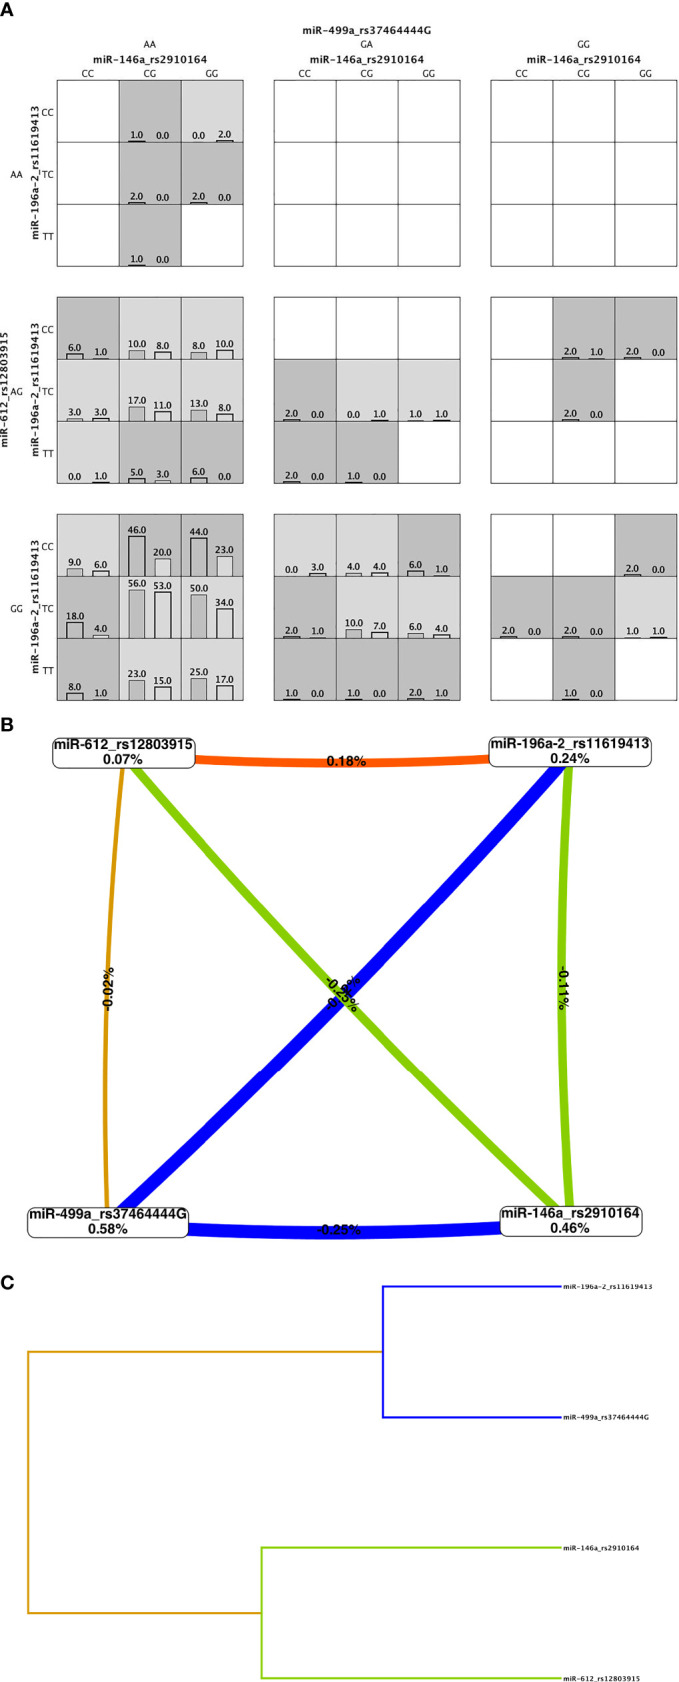
Figure 1.

Multifactor dimensionality reduction (MDR) analysis. (A) Four-locus MDR model. Genotype combinations with high risk (shaded dark grey) and low risk (shaded light grey) for acute lymphoblastic leukemia (ALL) and their distribution in cases (left bar) and controls (right bar). The patterns of high (shaded and low-risk cells, which differ across each of the different multi locus dimension, means that the influence each genotype on the ALL risk is dependent on the genotypes a each of the other three loci. (B) Interaction entropy graph for gene-gene interaction and ALL risk. Graph shows the percent of the entropy in case-control removed by each factor (boxes) and by each pair-wise combination of attributes (lines). Positive value and orange line indicate low degree of synergy and negative values and blue and green lines mean redundancy. Gold line means independency. (C) The dendrogram graphic shows the presence, strength, and nature of epistatic effects. The shorter the line connecting two attributes the stronger the interaction. Strength of interaction goes from left to right (gray line).
