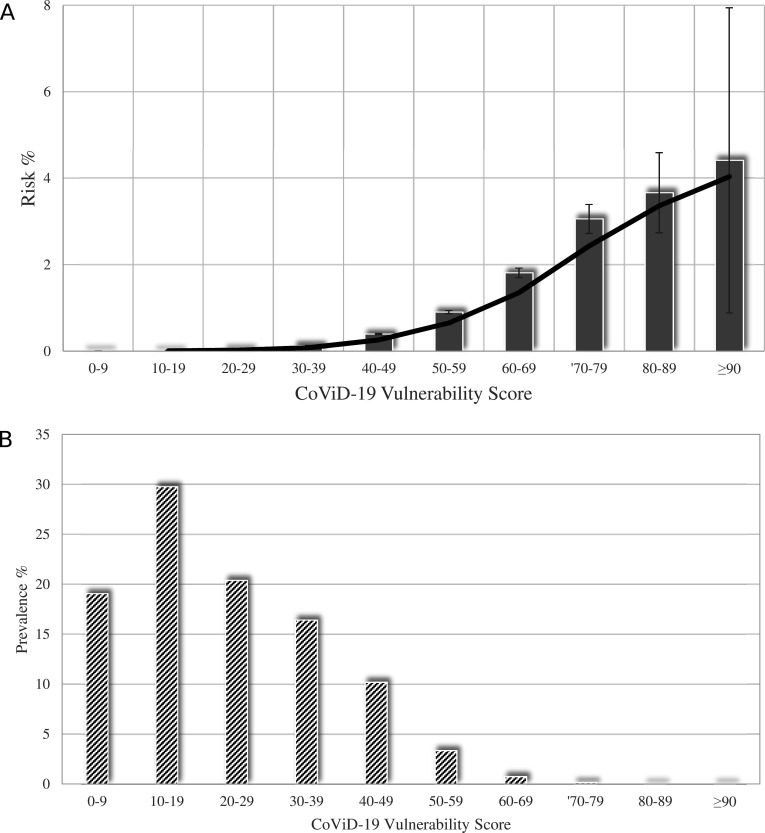
Figure 1.
Relationship between categories of COVID-19 Vulnerability Score and (A) the risk of occurrence of severe/fatal forms of COVID-19, (B) its distribution among National Health Service beneficiaries. Columns indicate the observed values (of risk and prevalence, respectively). Solid and dashed lines, respectively, represent the fitted cubic spline with the corresponding 5th and 95th percentiles. The analysis was based on the cohort of 7 655 502 beneficiaries of the Lombardy Region Health Service for at least 2 years, who on 21 February 2020 were alive, aged between 18 and 79 years and did not reside in a nursing home. During the first epidemic wave (until June 2020), this cohort experienced 9160 severe (intensive care unit admitted and mechanically ventilated via intubation) and/or fatal outcomes. The average incidence rate during the first wave was therefore 12.0 cases per 10 000 people at risk.

