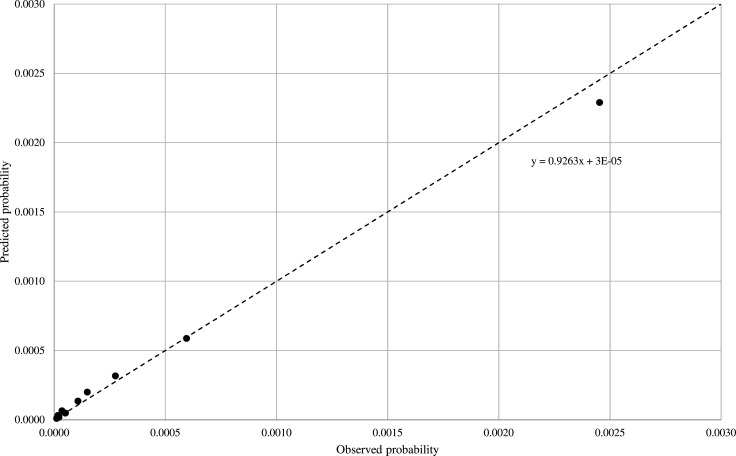
Figure 3.
Calibration plot of observed (X-axis) versus predicted (Y-axis) risk of severe/fatal outcomes. The analysis was based on the pooled validation sets of 15 441 033 residents from Lombardy, Valle d’Aosta, Marche, Puglia and Sicily who experienced 7031 severe/fatal outcomes from starting (1 July 2020 in Lombardy, or 1 March 2020 in the other regions) until 31 December 2020.

