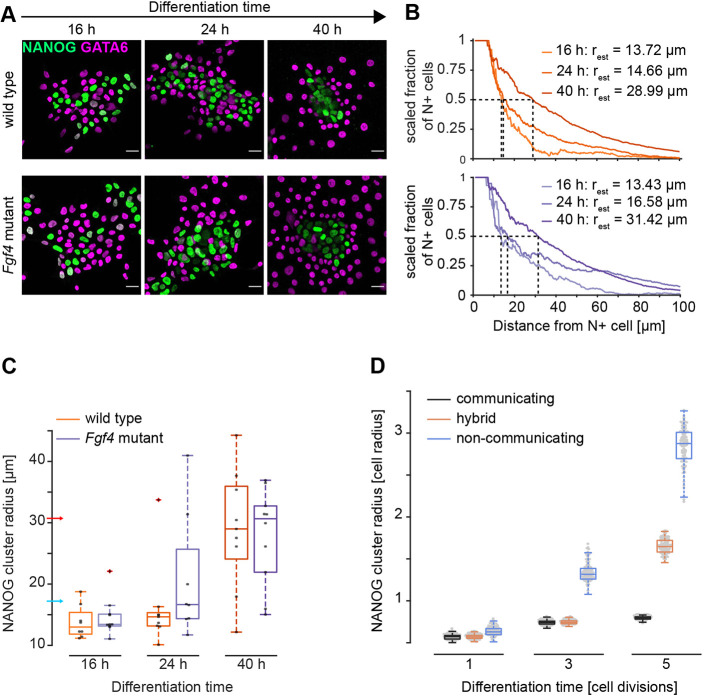
Fig. 5.
Spatial arrangement of cell types in wild-type and Fgf4-mutant cells. (A) Representative immunostainings of wild-type and Fgf4-mutant cells for NANOG (green) and GATA6 (magenta) at different time points after the initiation of differentiation. Wild-type cells were induced with doxycycline for 8 h and differentiated in N2B27; Fgf4-mutant cells were induced for 4 h and differentiated in N2B27 supplemented with 10 ng/ml FGF4. (B) Estimation of NANOG cluster radius in a single field of view for wild-type (orange, top) and Fgf4-mutant cells (blue, bottom) differentiated as in A. Graphs depict the scaled fraction of NANOG+ cells within a specific radius around seed cells. Dashed lines indicate determination of cluster radii. (C) Summary statistics of cluster radii for wild-type (orange) and Fgf4-mutant cells (blue) differentiated as in A. Dots indicate values from individual fields of view, box plots show median (boxes), interquartile ranges (whiskers) and outliers (red cross). Blue and red arrows indicate mean distance between nearest and second-nearest neighbors, respectively (Fig. S5). n=2, n≥8 for wild-type, and n=1, n≥8 for Fgf4-mutant cells. (D) NANOG+ cluster radii quantified from 100 independent numerical realizations of the model with continuous communication (gray), without communication (blue), and of a hybrid model in which communication is switched off after the third division (orange). Box plots show median (boxes) and interquartile ranges (whiskers). Scale bars: 20 µm.

