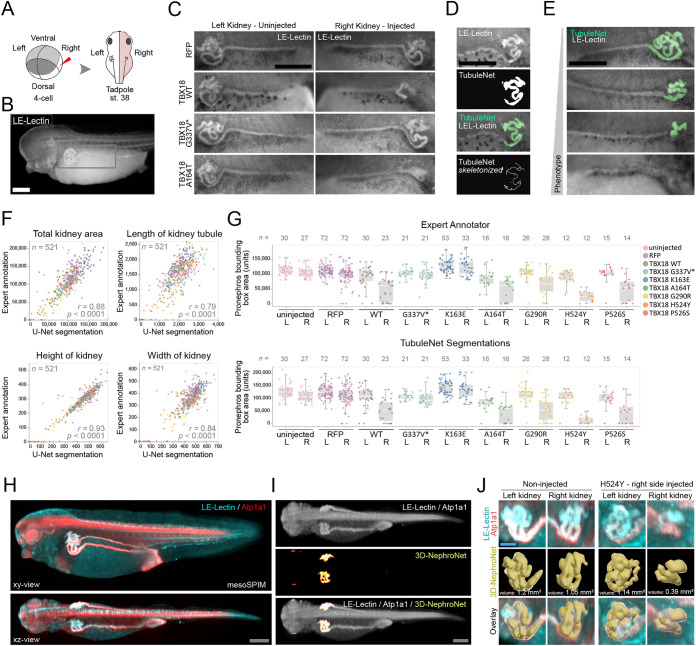
Fig. 1.
Deep learning for 2D and 3D phenotyping of altered pronephros development in Xenopus. (A) Schematic of unilateral TBX18 expression by injection of mRNA at the four-cell stage in X. laevis embryos. Kidney development was assessed on both sides at NF stage 38. (B) Fluorescence microscopy image of an LE-Lectin stained embryo. The gray rectangle indicates the region shown at higher magnification in C. Scale bar: 500 μm. (C) Overexpression of RFP or truncated TBX18 (G337V*) did not affect right-sided kidney morphology when compared with left non-injected side. In contrast, overexpression of TBX18 wild-type and A164T resulted in unilateral kidney hypoplasia. Scale bar: 500 μm. (D) A neural network (TubuleNet) was trained to assess pronephros morphology. Top to bottom: input image of an LE-lectin stained pronephros, the output as a segmentation mask, overlay of input image and mask, and skeletonized mask for feature extraction. Scale bar: 500 μm. (E) TubuleNet accurately segmented renal tubules across a wide phenotypic range (normal, hypoplastic, absent). Scale bar: 500 μm. (F) TubuleNet segmentations closely correlated with expert human annotators on unseen data. r, Pearson's correlation coefficient. (G) Plot of pronephros bounding box area per expressed construct shows high agreement between expert annotator and TubuleNet segmentation. L, left (uninjected) side; R, right (injected) side. Boxes and whiskers indicate interquartile range and variability outside the upper and lower quartiles. (H) mesoSPIM light-sheet microscopy in toto imaging of a wild-type embryo stained for LE-Lectin (cyan) and Atp1a1 (red). Scale bar: 200 μm. (I) The two channels were merged as input images (top), accurate segmentation by 3D-NephroNet in the volume. Scale bar: 200 μm. (J) 3D segmentation for feature extraction and volumetric measurements. Unilateral expression of TBX18 H524Y resulted in a reduction of 66% in tubule volume on the injected side. Scale bar: 40 μm.

