Fig. 3.
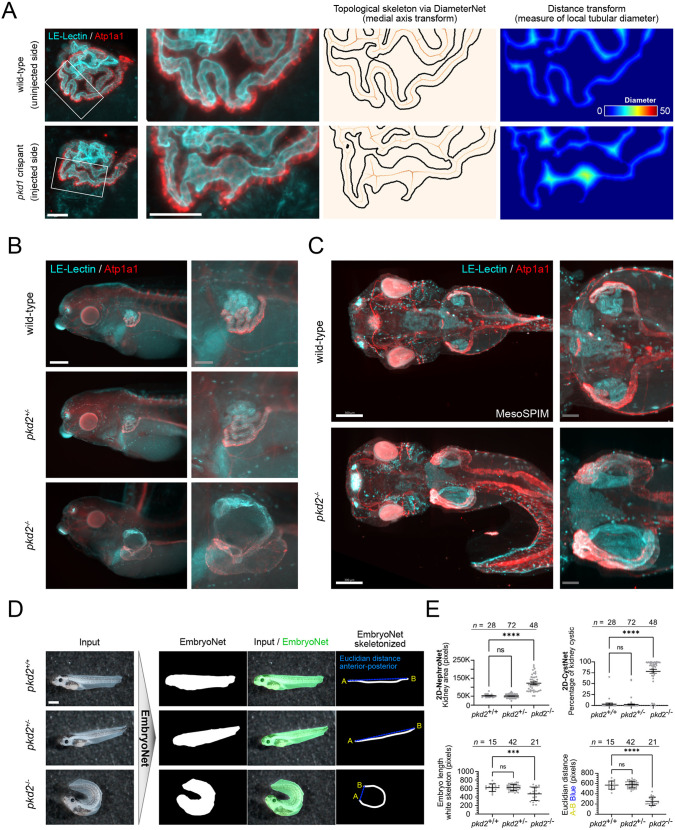
Localized renal cysts in pkd1 crispants and phenotypic characterization of a pkd2 knockout line. (A) High-resolution mesoSPIM imaging was used to generate a topological skeleton via DiameterNet and a distance transformation was used as a measure of local tubular diameter. Scale bars: 50 μm. (B) Immunofluorescence microscopy showed pronounced tubular dilation in pkd2 knockout X. laevis. Scale bars: 300 μm (white); 100 μm (gray). (C) mesoSPIM light-sheet microscopy in toto imaging of pkd2+/+ and pkd2−/− embryos (dorsal view). Scale bars: 300 μm (white); 100 μm (gray). (D) Bright-field images of pkd2+/+, pkd2+/− and pkd2−/− animals. EmbryoNet masks were used for skeletonization. Scale bar: 1 mm. (E) Fully automated measurements of kidney tubule area and percentage of cystic area using 2D-NephroNet and 2D-CystNet (Kruskal–Wallis with Dunn's multiple comparison: ns, not significant, ****P<0.0001). Fully automated measurements of embryo length (Longest Shortest path skeletonized EmbryoNet, white, ***P<0.001) and a measure of embryo curliness (Euclidian distance between A and B, blue, ****P<0.0001). Data are mean±s.e.m.

