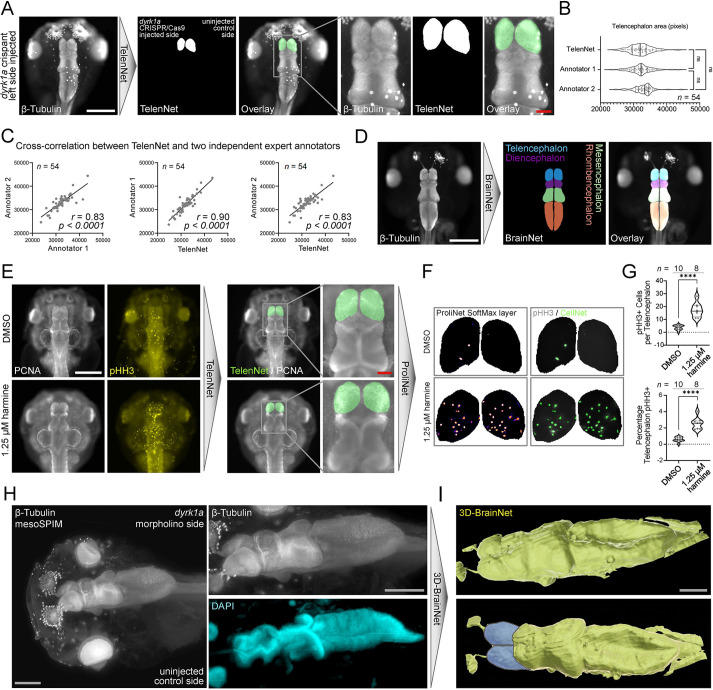
Fig. 4.
Deep-learning analysis of neural phenotypes in a dyrk1a-depleted embryos. (A) TelenNet for automated segmentation of the telencephalon (forebrain) from whole-mount β-tubulin immunofluorescence stainings imaged by wide-field microscopy of dyrk1a CRISPR/Cas9-edited embryos. TelenNet independently segmented the telencephalon on either side of the midline. (B) Telencephalon area as determined by manual assessment of two independent expert human annotators and TelenNet. As TelenNet was trained by annotator 1, automated measurements were similar to those of annotator 1 (ANOVA, ns; Kruskal-Wallis, ns). (C) Cross-correlation between TelenNet and each independent annotator. (D) BrainNet achieved multiclass segmentation of various brain regions (telencephalon, diencephalon, mesencephalon and rhombencephalon) bilaterally. (E-G) Chained image processing pipeline for cell counting in the telencephalon. (E) TelenNet was fine-tuned to recognize telencephalons in PCNA-stained embryos and the resulting masks were used to isolate the left and right telencephalons from the pHH3-channel. (F) A cell-counting model (ProliNet) identified pHH3+ cells. (G) The number of proliferating (pHH3+) cells in the telencephalon of harmine-treated embryos (unpaired t-test: ****P<0.0001) and the percentage of telencephalon area covered by pHH3+ cells (unpaired t-test: ****P<0.0001) were significantly increased. (H) mesoSPIM light-sheet in toto imaging of a dyrk1a unilateral (right) morphant stained for β-tubulin and counterstained with DAPI. (I) A sparse annotation approach was used to segment the Xenopus brain using 3D-BrainNet. The telencephalon is pseudo-colored in blue. Scale bars: 500 μm (white); 100 μm (gray).

