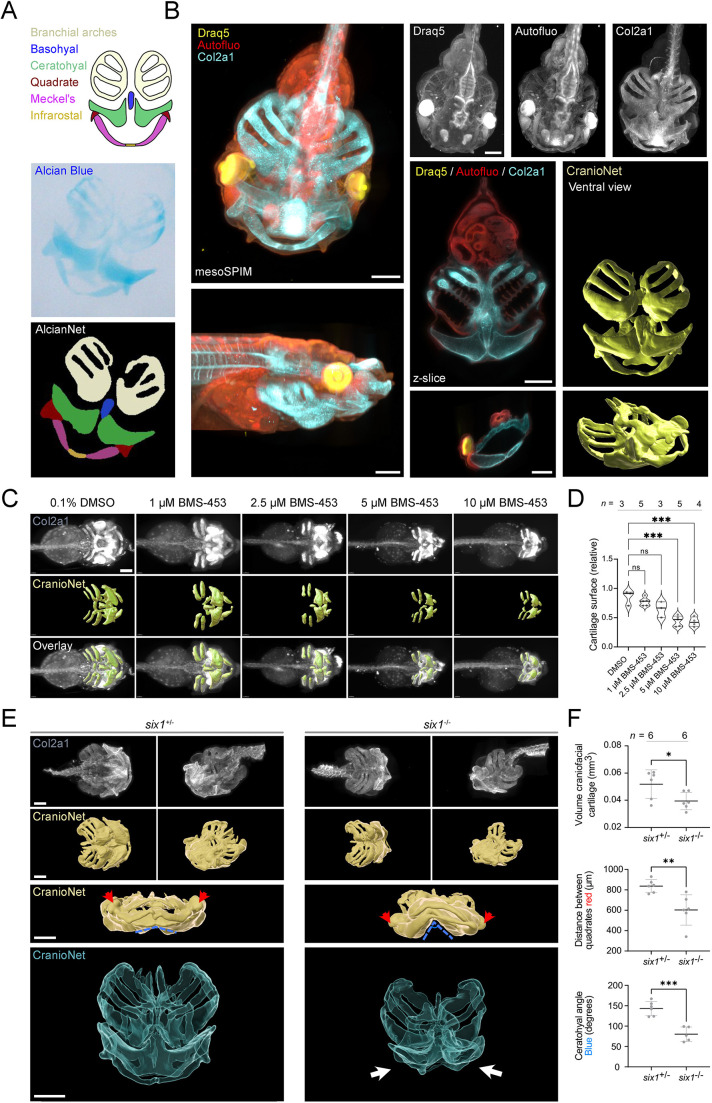
Fig. 5.
Volumetric analysis of craniofacial abnormalities induced by retinoic acid inhibition and in six1−/− X. tropicalis embryos. (A) Schematic of the Xenopus craniofacial cartilages. AlcianNet achieved multiclass segmentation of craniofacial elements from Alcian Blue stained X. tropicalis embryos. (B) mesoSPIM light-sheet in toto imaging of a wild-type embryo stained for Col2a1. CranioNet based 3D-segmentation of craniofacial cartilages (yellow). Autofluorescence (Autofluo, red) recorded at 488 nm excitation. (C) Three-dimensional quantitative phenotyping of X. tropicalis revealed a dose-dependent response to the retinoic acid inhibitor BMS-453. (D) Quantification of the normalized cartilage surface revealed a BMS-453 dose-response curve (ANOVA, P<0.0001; Holm–Šidák multiple comparison, ***P<0.001). (E) Morphological differences between six1 heterozygous and homozygous knockout embryos. The arrows indicate the collapsed dysmorphic Meckel's and ceratohyal cartilages in six1 knockouts. (F) Quantification revealed lower gross cartilage volume of six1 knockouts, a decreased distance between quadrates (red arrows) and an increase in the ceratohyal angle (dashed blue line) (unpaired t-test: *P<0.05, **P<0.01, ***P<0.001). Data are mean±s.d. Scale bars: 200 μm.

