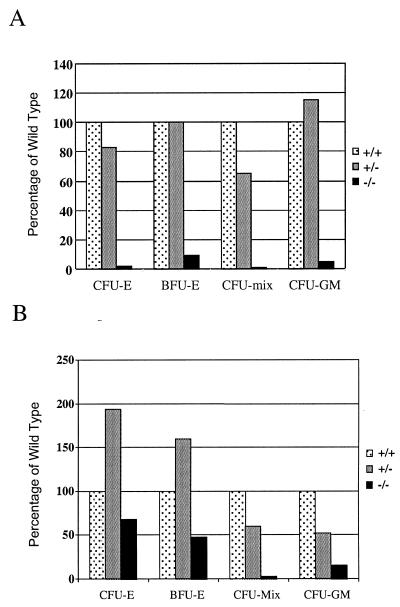
FIG. 5.
Fli1 mutant mice demonstrate defects in hematopoietic colony formation. (A) E11 fetal liver cultures (triplicate cultures using 10,000 fetal liver cells/dish) in medium containing SF, IL-3, and Epo. CFU-E colonies were counted on day 2, and other colonies were counted on day 7. Data represent the mean values from individual fetuses of each genotype. +/+, n = 3; +/−, n = 3; −/−, n = 2. (B) E10 yolk sac cultures (quadruplicate cultures containing 1/15 yolk sac per dish) in medium containing SF, IL-3, IL-6, and Epo. CFU-E colonies were scored on day 4, and other colonies were scored on day 7. Data presented represent the mean values from individual fetuses. +/+, n = 4; +/−, n = 2; −/−, n = 2. The data presented in the figure represent the average numbers from experiment 1 of two experiments (all data are provided in Tables 2 and 3). Values are expressed as percentage of the wild type.

