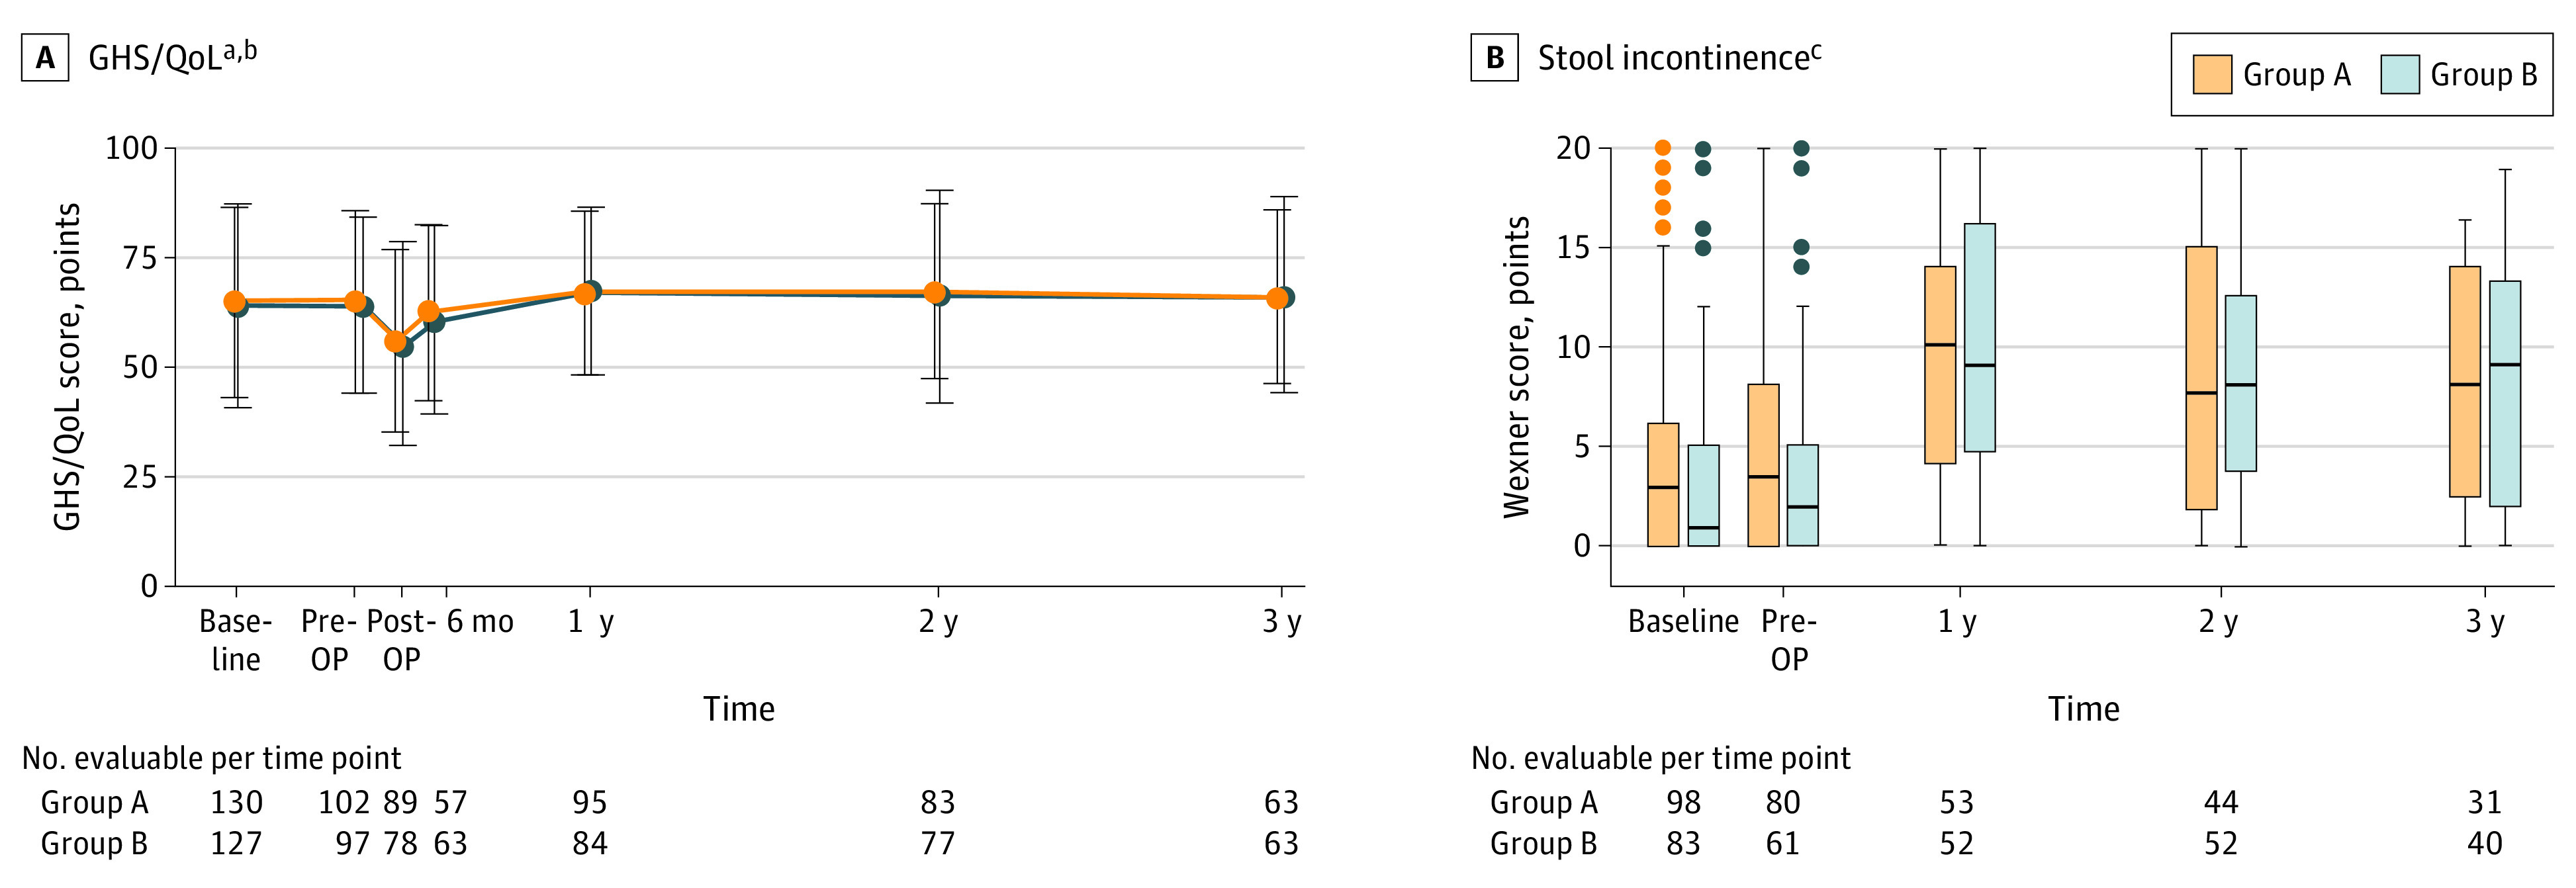
Figure 3. Quality of Life (QoL) and Incontinence Changes Over Time in Both Treatment Groups .

A, Global health status (GHS)/QoL score, assessed by the European Organisation for Research and Treatment of Cancer (EORTC) QLQ-C30 questionnaire in the 2 groups, as indicated. B, Stool incontinence, assessed by the Wexner score. The Wexner score postoperatively and at 6 mo after randomization is not shown as most patients still had a protective ileostomy at this time point. A higher score represents worse incontinence status. OP indicates operation.
aOf note, only disease-free patients were included in the analysis, whereas patients who refused surgery due to clinical complete response were excluded (data shown separately in eFigures 4A and B in Supplement 1).
bData are shown as mean (SD) score. A higher mean score represents a better level of GHS/QoL status.
cBaseline patient numbers for the Wexner score are lower compared with those for GHS/QoL score in Figure 3A as patients who initially received a protective ileostomy were excluded from the stool incontinence analysis. Similarly, patients with cCR were excluded (data shown separately in eFigures 4C and D in Supplement 2).
