Figure 5.
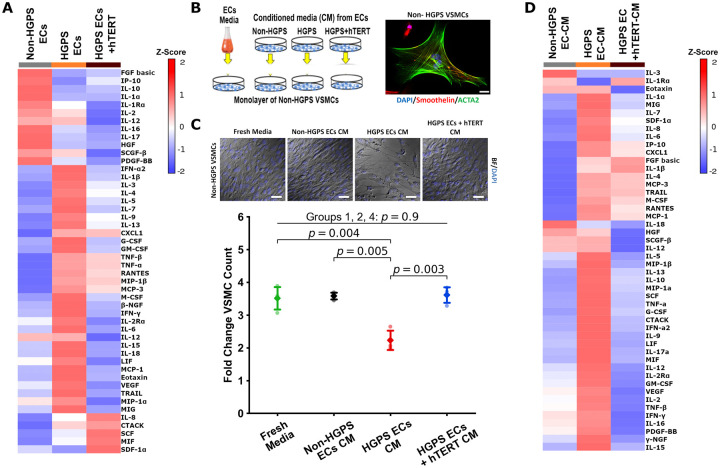
hTERT treatment reverses senescence-associated secretory phenotype in Hutchinson-Gilford progeria syndrome endothelial cells. Treatment of Hutchinson-Gilford progeria syndrome endothelial cells with hTERT reduces the senescence-associated secretory phenotype profile as measured by Bio-Plex analysis (A). To assess how these secreted factors may negatively affect other relevant vascular cells, a conditioned media experiment was set up using non-Hutchinson-Gilford progeria syndrome vascular smooth muscle cells differentiated from the control donor as detailed in (B). To confirm differentiation, vascular smooth muscle cells were stained for smooth muscle cell specific markers smoothelin and α-actin 2 (ACTA2, scale bar—25 µm). When these control vascular smooth muscle cells were subject to the various conditioned media, their proliferation was greatly reduced when cultured under the Hutchinson-Gilford progeria syndrome endothelial cell conditioned media, but proliferation was not affected when Hutchinson-Gilford progeria syndrome endothelial cells treated with hTERT supplied the conditioned media (n = 3, C, scale bar—50 µm). Bio-Plex analysis of vascular smooth muscle cells exposed to different conditioned media demonstrated that vascular smooth muscle cells themselves also secreted more inflammatory markers when cultured under Hutchinson-Gilford progeria syndrome endothelial cell donor media, though this shift was attenuated when hTERT treated Hutchinson-Gilford progeria syndrome endothelial cells were the donor (D). Fold-change vascular smooth muscle cell count is the endpoint cell count of each group divided by its respective initial seeding cell count. Analysis of (C) was tested using a one-way ANOVA with post hoc Tukey’s test for group differences. Significance was taken at P < 0.05, in (C) only significant changes between groups are annotated, all other between-group statistics did not reach significance. All error bars show standard deviation.

