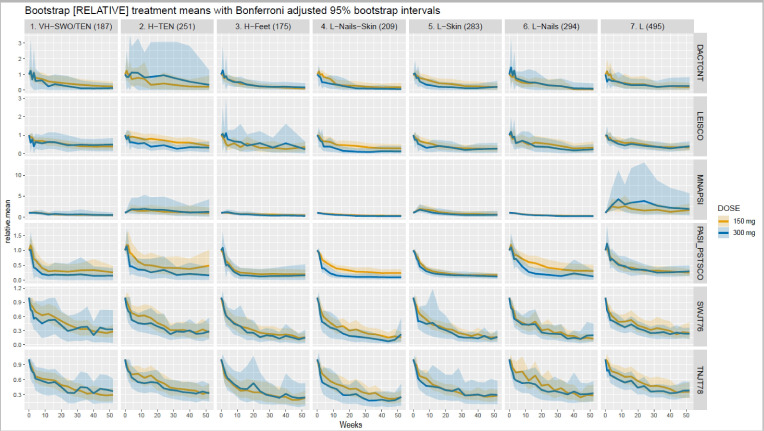
Figure 3.
Relative mean response curves for patients on secukinumab. Relative mean response curves for patients on secukinumab 150 mg (red curves) and 300 mg (green curves) across the seven clusters for the six clinical indicators. The red curves depicted the relative mean responses for patients having received secukinumab 150 mg, while the green curves depicted that for secukinumab 300 mg. It is to be noted that the two relative dose response curves always started at baseline at the same mean value equal to 1 to adjust for different starting values. The coloured shaded regions represented 95% bootstrap CIs.

