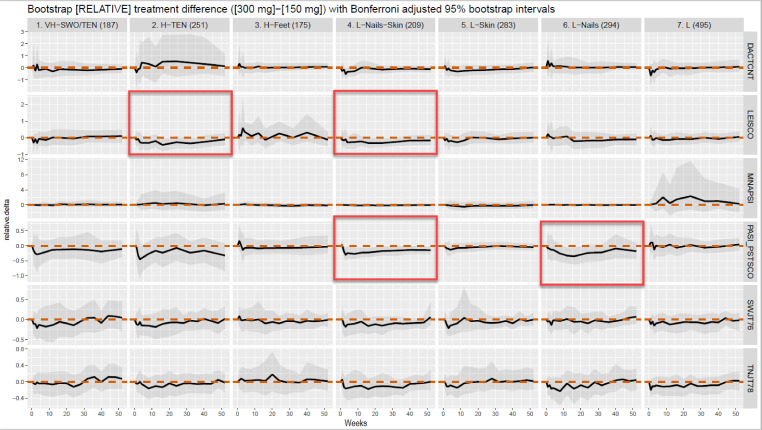
Figure 4.
Differences between the relative mean responses to secukinumab doses. Differences between the relative mean responses to secukinumab 300 and 150 mg across the seven clusters for each of the six clinical indicators. The curves pass through zero at baseline to ensure that the observed treatment differences are not due to the two patient populations starting from a different baseline disease activity. The shaded region provides a Bonferroni adjusted 95% bootstrap CI to make inference on treatment differences. If the shaded region excluded the zero line, (the red dashed line) then the longitudinal treatment difference between secukinumab 300 and 150 mg is deemed statistically significant. If, however, the shaded region included the zero line then there was not enough evidence to claim a treatment difference for that cluster and clinical indicator.

