Figure 3.
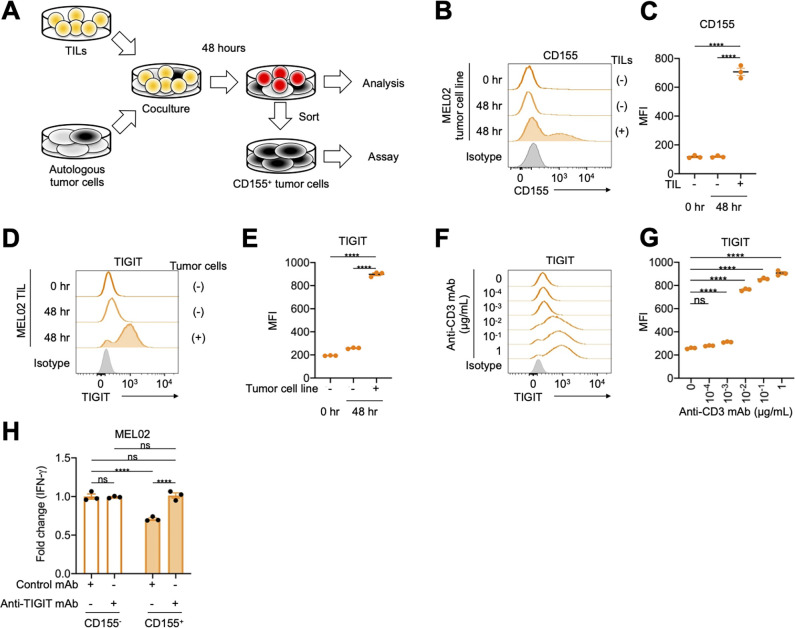
The TIGIT/CD155 axis induces acquired resistance to immunotherapy. (A) Graphical experimental schema of the in vitro acquired resistance model. Autologous tumor cells were cocultured with paired TILs for 48 hours, and both were subsequently analyzed with flow cytometry. In addition, CD155-expressing tumor cells were sorted and subjected to functional assay. (B–E) CD155 expression in MEL02 tumor cells and TIGIT expression in tumor-infiltrating T cells from MEL02. Expression was analyzed 48 hours after coculture as described in (A). Representative flow cytometry staining (B, tumor cells; D, tumor-infiltrating T cells) and summaries of MFI (C, tumor cells; E, tumor-infiltrating T cells) are shown. (F and G) TIGIT expression in tumor-infiltrating T cells from MEL02. MEL02 TILs were stimulated by anti-CD3 mAb with indicated concentrations and anti-CD28 mAb for 48 hours and were subsequently analyzed with flow cytometry. Representative flow cytometry staining (F) and summary of MFI (G) are shown. (H) IFN-γ release assay. CD155- or CD155+ autologous tumor cells and paired TILs from MEL02 were cocultured with or without anti-TIGIT mAb for 24 hours. Supernatants were analyzed with ELISA for IFN-γ. Fold changes to CD155− tumor cells with control mAb are shown. All in vitro experiments were performed in triplicate, and one-way analysis of variance with Bonferroni corrections were used in (C), (E), (G), and (H) for statistical analyses. The means and SEM are shown. ****, p<0.0001; ns, not significant; hr, hour; IFN-γ, interferon γ; MFI, mean fluorescent intensity; TILs, tumor-infiltrating lymphocytes.

