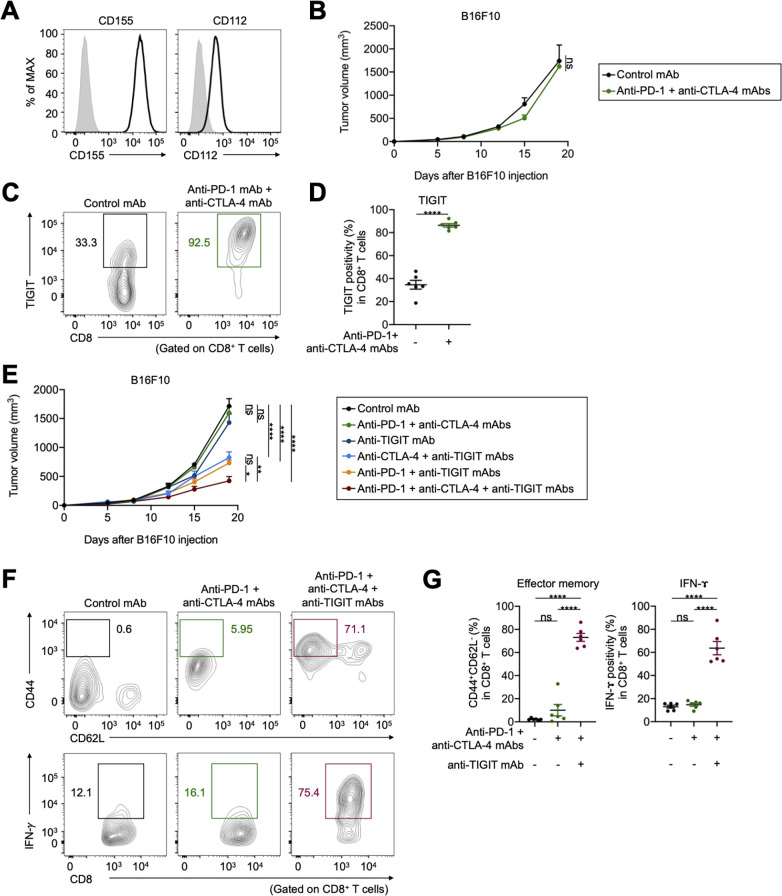
Figure 4.
TIGIT blockade overcomes resistance to ICIs in vivo mouse models. (A) CD155 and CD112 expression in B16F10 cells. Representative flow cytometry staining from triplicated experiments are shown. Gray, isotype. (B) Tumor growth treated with combination treatment of anti-PD-1 and anti-CTLA-4 mAbs. Cells (1×10⁶) were injected subcutaneously (n=5 per each group), and tumor volume was monitored two times a week. Mice were grouped when the tumor volume reached approximately ~100 mm3, and ICIs were administered intraperitoneally three times every 3 days thereafter. (C and D) TIGIT expression in tumor-infiltrating CD8+ T cells. Tumors were harvested 7 days after treatment initiation to collect TILs for evaluation. Representative flow cytometry staining (C) and summary (D) are shown. (E) Tumor growth treated with combination treatment of anti-PD-1, anti-CTLA-4, and anti-TIGIT mAbs. In vivo experiments were performed as described in (B). (F and G) The frequencies of CD44+CD62L− effector memory, and cytokine-producing CD8+ T cells in the TME. TILs were analyzed as described in (C and D). Representative flow cytometry staining (F) and summaries (G) are shown. All in vivo experiments were performed in duplicates, with similar results. A two-way ANOVA was used in (B), a t-test was used in (D), two-way ANOVA with Bonferroni corrections were used in (E), and one-way ANOVA with Bonferroni corrections were used in (G) for statistical analyses. The means and SEM are shown. *, p<0.05; **, p<0.01; ****, p<0.0001; ANOVA, analysis of variance; CTLA-4, cytotoxic T-lymphocyte-associated protein 4; ICIs, immune checkpoint inhibitors; ns, not significant; PD-1, programmed death 1; TILs, tumor-infiltrating lymphocytes; TME, tumor microenvironment.

