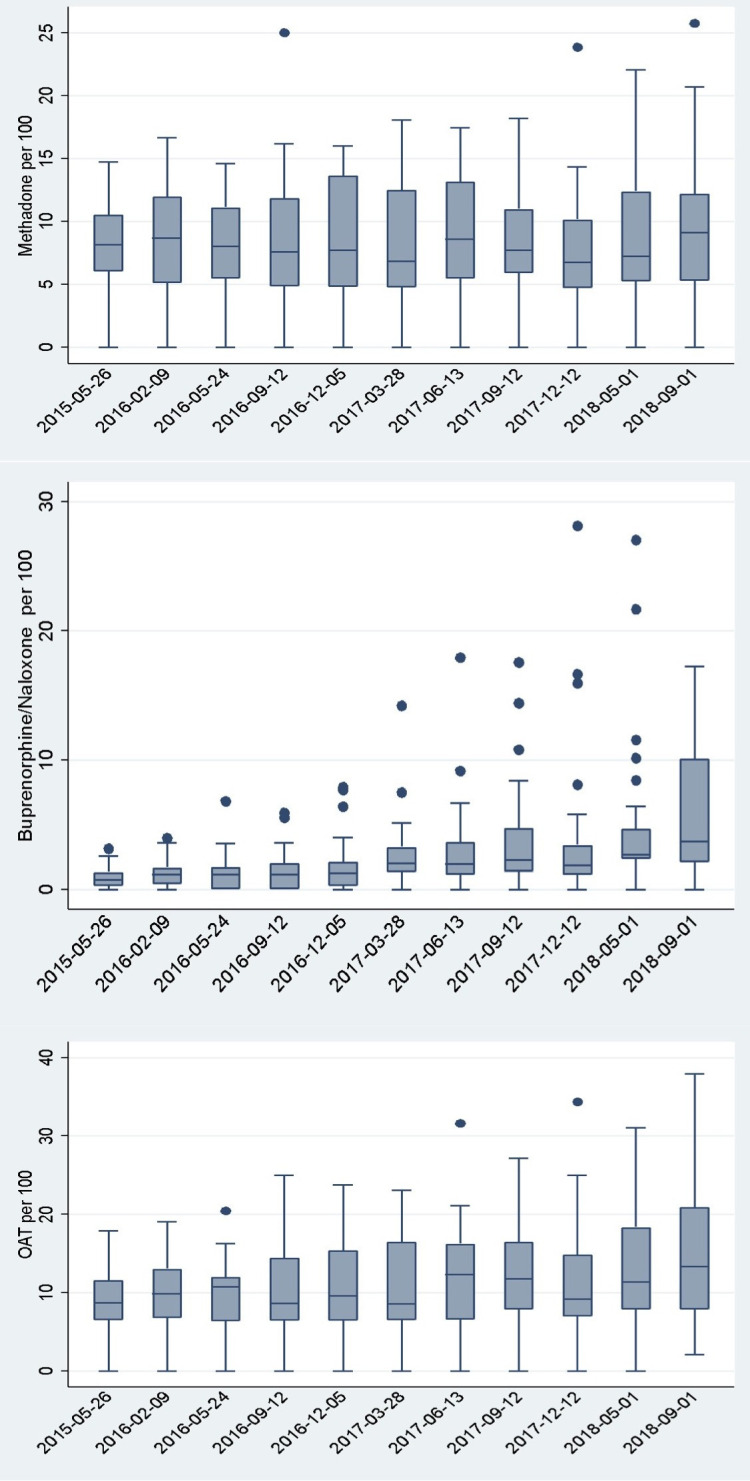
Figure 2.

Box plots* of percent of people prescribed methadone, buprenorphine/naloxone or either per quarter across provincial prisons in Ontario, 2015–2018. *The centre line indicates the median prevalence of prescribing, and the box shows the range in rates for the 25th and 75th percentiles for prevalence of prescribing; dots indicate provincial prisons with extreme prevalence rates. OAT, opioid agonist treatment.
