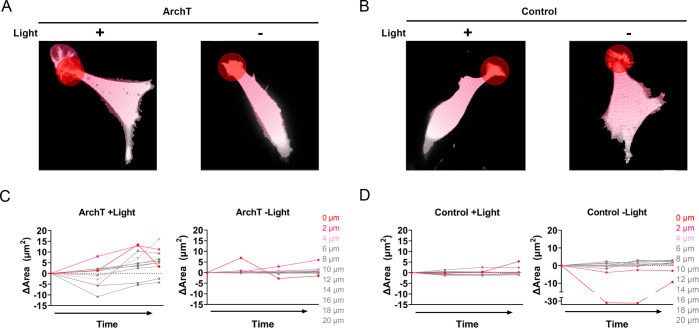
Figure 4.
Quantification of local membrane protrusion events. Representative segmentation analysis of ArchT (A) and Control (B) cells from Figure 3 (see Methods). Briefly, concentric segmentation circles radiate out at 2 μm intervals from the edge of the stimulation (+Light) or mock stimulation (-Light) ROI (red circle). Change in area for segmented ArchT (C) and Control (D) cell; where 0 μm indicates the stimulation ROI with increasing 2 μm intervals for each subsequent segment. Analysis of additional representative cells can be found in Figure S6 (stimulated) and S7 (unstimulated).

