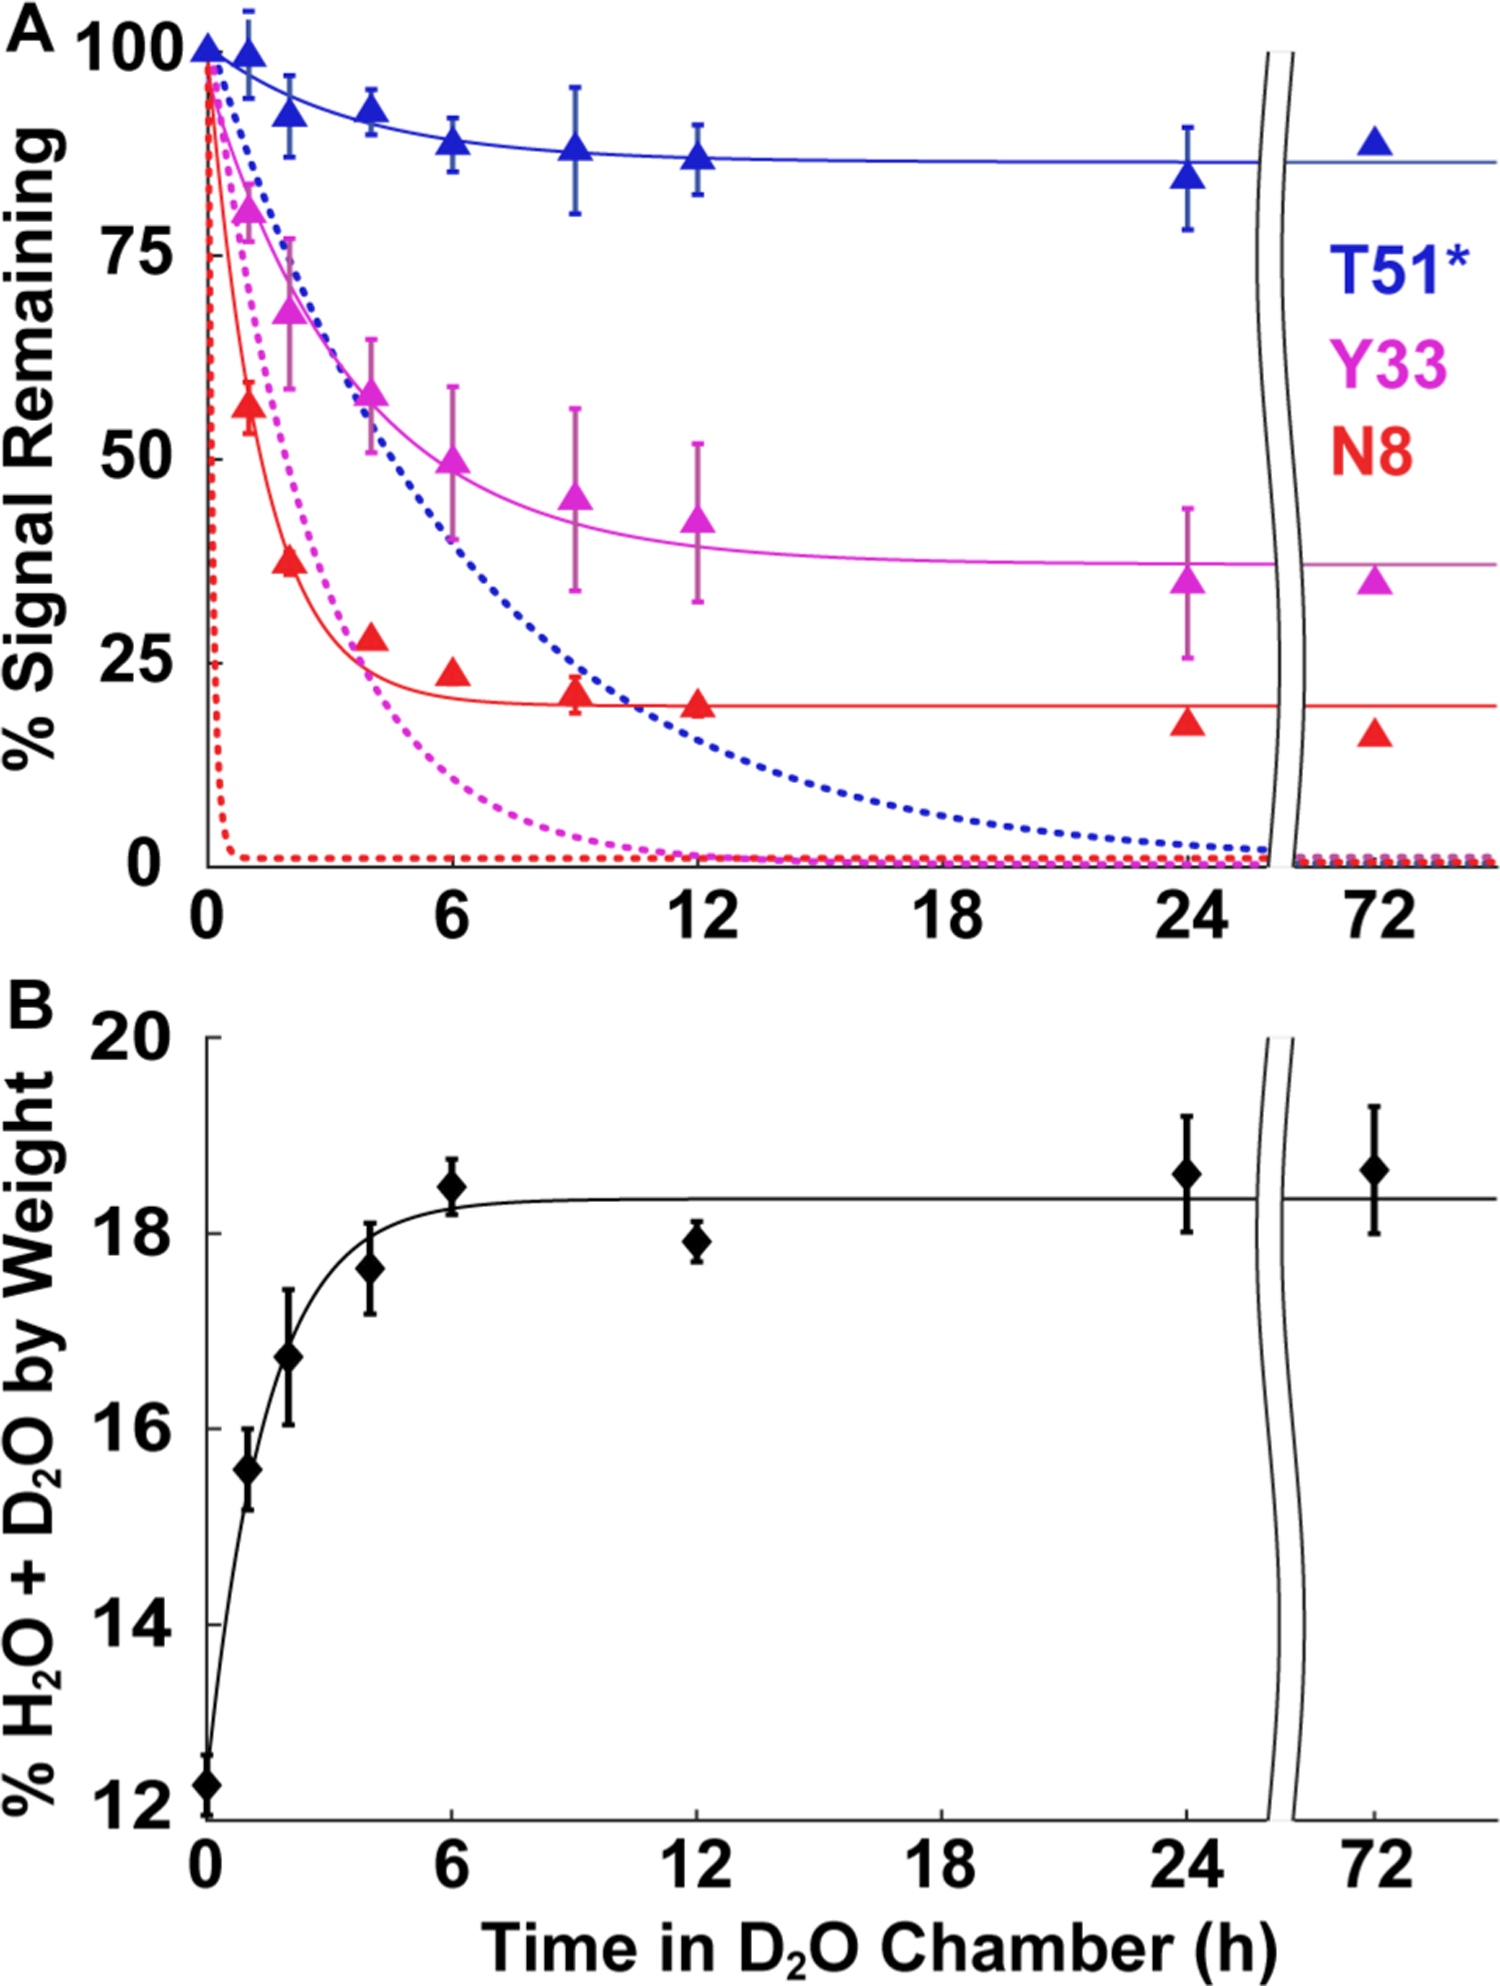
Figure 2.

Time courses of solution HDX, vapor exchange, and vapor sorption. (A) Signal remaining as a function of time in D2O liquid (dotted lines) or vapor (75% RH, triangles) for three GB1 residues representing different solution exchange rate regimes: slow (blue, complete in >24 h), intermediate (pink, 2–24 h), and fast (red, <2 h). For T51* in solution, the abscissa is compressed 10-fold (e.g., 6 h corresponds to 60 h). Solution exchange curves are derived from the average kobs from three independent experiments in 7.5 mM HEPES (pH 7.5) (>99% D2O). For the vapor exchange time course, identical GB1 samples were freeze-dried in 1.5 mM HEPES (pH 6.5) for 24 h and resuspended in H2O-based quench buffer after vapor exchange for 0, 1, 2, 4, 6, 9, 12, 24, and 72 h at 75% RH. Spectra were acquired at 4 °C immediately upon resuspension. Vapor data are uncorrected for quench labeling. (B) Average %(H2O + D2O) content (w/w) of freeze-dried GB1 as a function of time spent at 75% RH in a D2O chamber. After 72 h at 75% RH, the accessible GB1 surface covered by H2O and D2O is ≤40% for drying from buffer alone, ≤60% for drying from buffer with 20 g/L urea, and ≤170% (approximately two layers of H2O and D2O) for drying from buffer and 20 g/L trehalose (Table S3). For vapor exchange and sorption, curves are of no theoretical significance. Error bars represent the standard deviation of the mean from three independent experiments, except for the 72 h vapor exchange data in panel A, which are from a single experiment.
