
Figure 4.
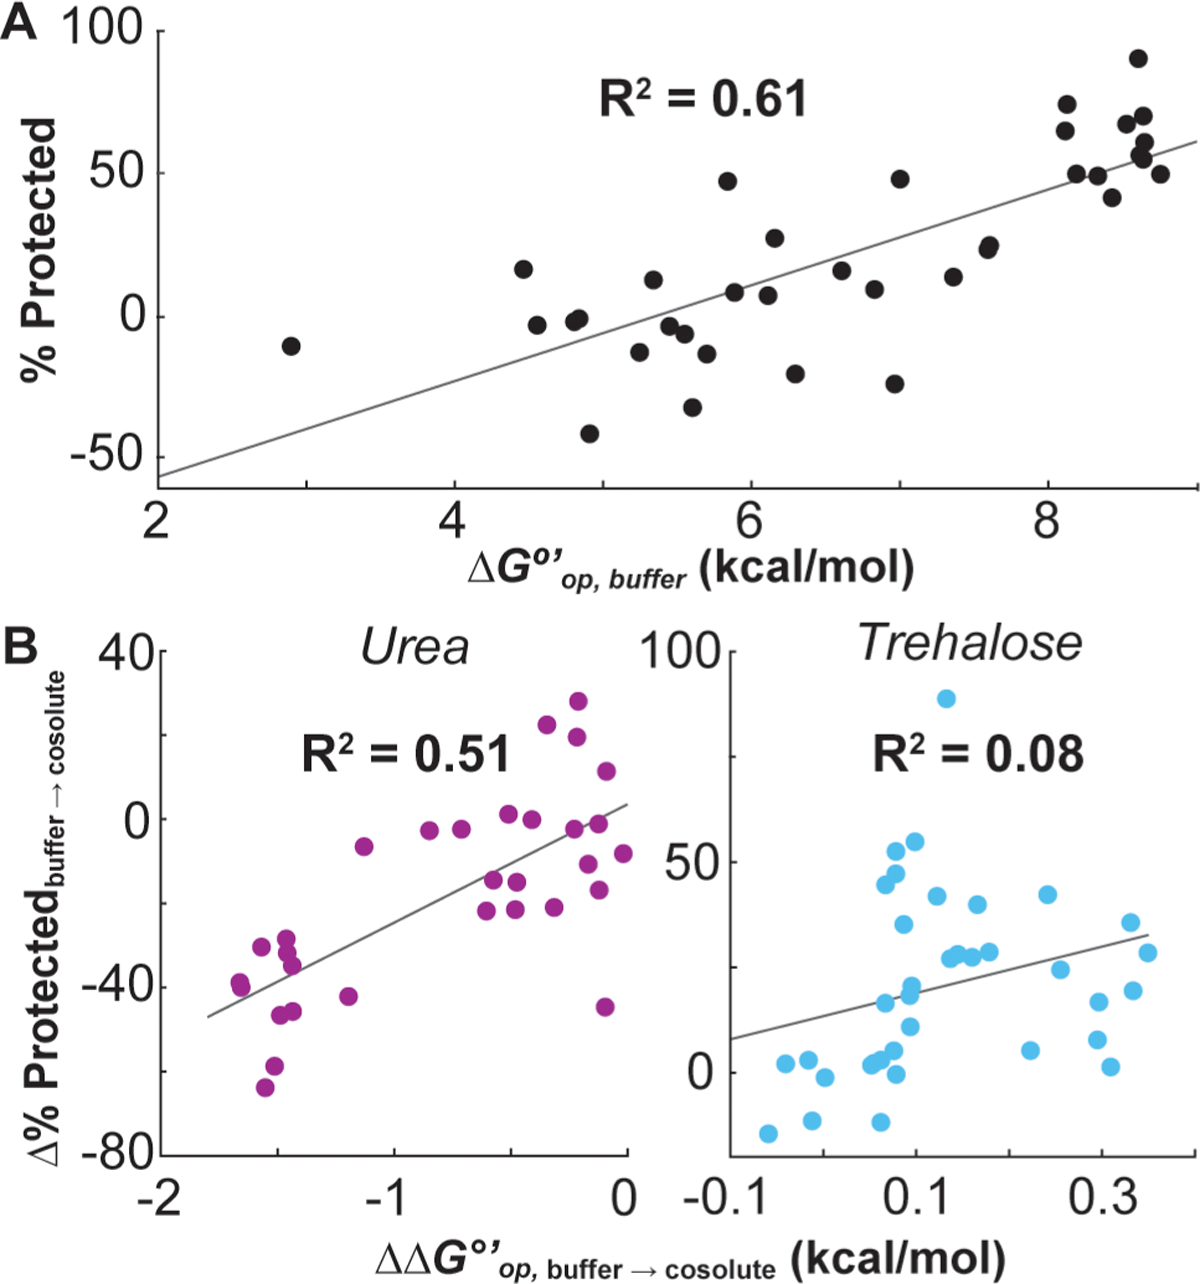
Correlations of solution- and dry-state protection. (A) % protected after freeze-drying in buffer vs average opening free energy (ΔGop°′) in buffer for the 34 GB1 residues for which solution HDX rates could be measured. (B) Average Δ% protected due to drying with 20 g/L urea or trehalose vs the change in opening free energy (ΔΔGop°′) due to the presence of the same cosolute at 100 g/L (ΔΔGop°′ = ΔGop,cosolute°′ − ΔGop,buffer°′). % protected and ΔGop°′ values are reported with their uncertainties in Tables S4 and S5, respectively.