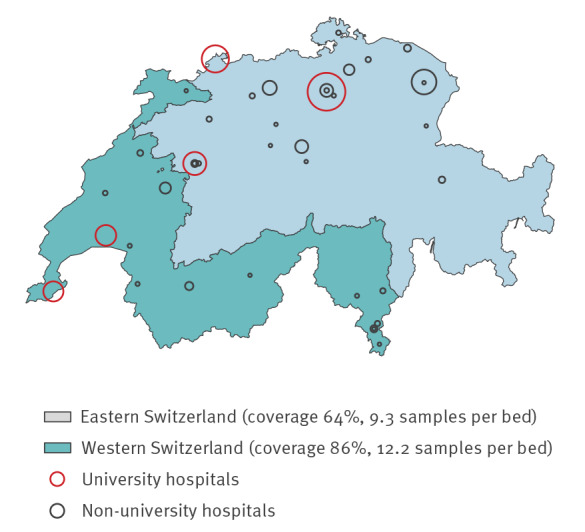
Figure 1.
Intensive care units represented in the analysis of antimicrobial resistance, Switzerland, 2009–2018 (n = 41)
The map is limited to institutions registered in 2018. Circle sizes represent number of samples. Coverage (i.e. number of beds of all registered beds) and sampling density (i.e. number of microbiological samples per represented beds) are given by geographical region.