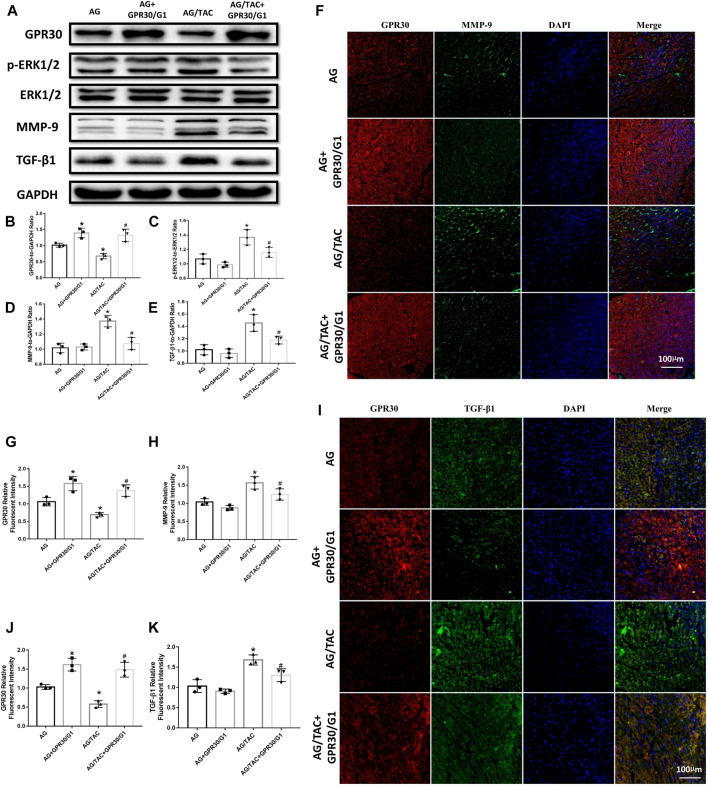
FIGURE 5.
Effects of 8-week GPR30/G1 treatment on the protein expression levels of GPR30, p-ERK1/2, ERK1/2, MMP-9, and TGF-β1 in mice subjected to TAC. (A) Representative images of the Western blot. (B) GPR30 protein level. (C) p-ERK1/2 to ERK1/2 protein level. (D) MMP-9 protein level. (E) TGF-β1 protein level. (F) Representative confocal microscopy images of myocardial tissue stained with GPR30, MMP-9, and DAPI. Red fluorescence for GPR30 expression. Green fluorescence for MMP-9 expression. Blue fluorescence for nuclei of total cells (bar = 100 μm). (G) IFC intensity of GPR30. (H) IFC intensity of MMP-9. (I) Representative confocal microscopy images of myocardial tissue stained with GPR30, TGF-β1, and DAPI. Red fluorescence for GPR30 expression. Green fluorescence for TGF-β1 expression. Blue fluorescence for nuclei of total cells (bar = 100 μm). (J) IFC intensity of GPR30. (K) IFC intensity of TGF-β1. The results are expressed as mean ± S.E.M, n = 3. *p < 0.05 compared with the AG group. #p < 0.05 compared with the AG/TAC group.

