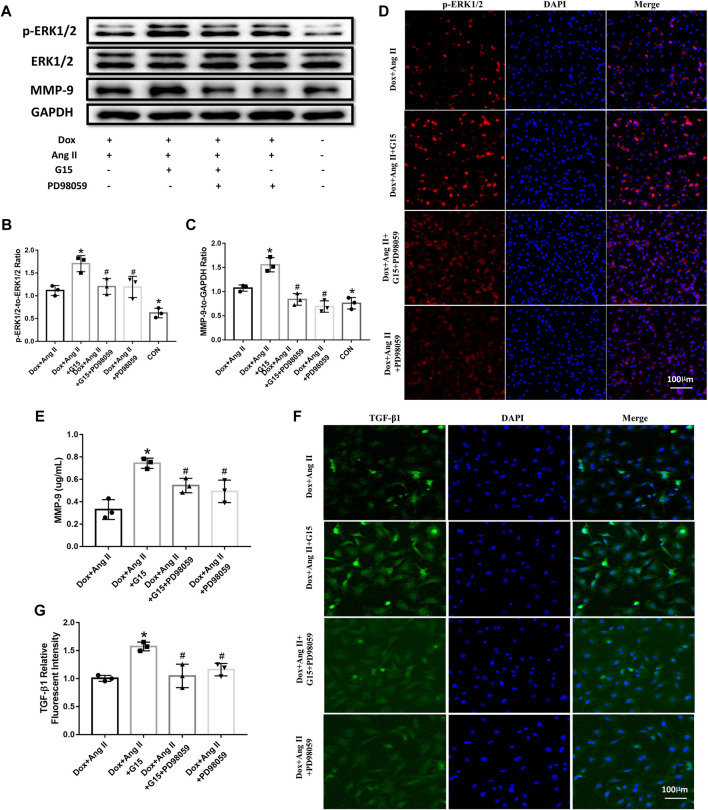
FIGURE 7.
Effects of GPR30 antagonist G15 on p-ERK1/2, ERK1/2, and MMP-9 in cardiomyocytes, and the effect on the expression of TGF-β1 in fibroblasts. (A) Representative blots of Western blot. (B) p-ERK1/2 to ERK1/2. (C) MMP-9 expression. (D) Representative confocal microscopy images of primary cultured cardiomyocytes stained with p-ERK and DAPI. Red fluorescence for p-ERK expression. Blue fluorescence for nuclei of total cardiomyocytes (bar = 100 μm). (E) The content of MMP-9 in the culture medium of cardiomyocytes. (F) Representative confocal microscopy images of primary cultured cardiomyocytes stained with TGF-β1 and DAPI. Red fluorescence for TGF-β1 expression. Blue fluorescence for nuclei of total cardiac fibroblasts (bar = 100 μm). (G) TGF-β1 expression. *p < 0.05 compared with the Dox + Ang Ⅱ group. #p < 0.05 compared with the Dox + Ang Ⅱ+G15 group.

