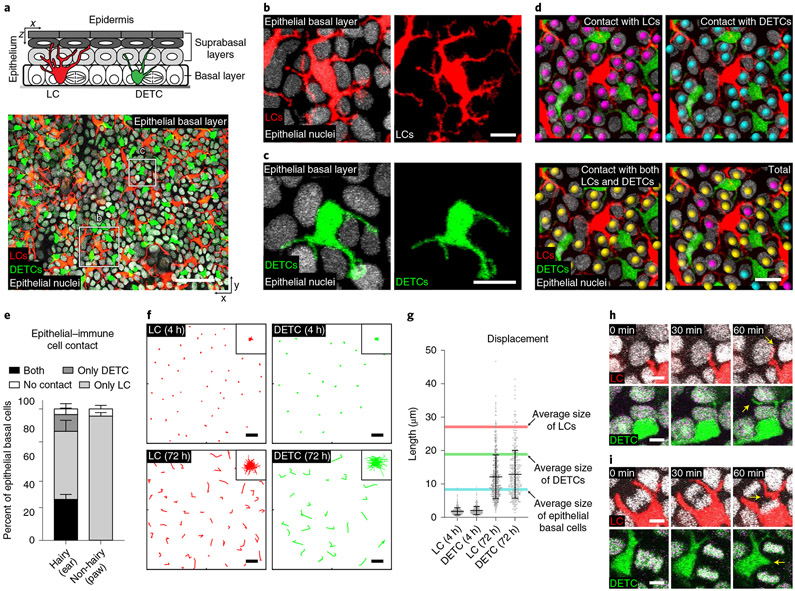
Fig. 1 ∣. LCs and DETCs maximally cover and adapt to changes of neighbouring epithelial basal cells during homeostasis.
a, Top: schematic of mouse epidermis with the basal layer highlighted in grey. Bottom: x–y view of the basal layer containing LCs (red), DETCs (green) and epithelial basal cells. Bottom: Representative x–z views from three mice. Red, LCs (huLangerin-CreER;Rosa-stop-tdTomato); green, DETCs (CX3CR1-GFP+/−); white, nuclei of epithelial cells (K14-H2B-Cerulean). Scale bar, 50μm. b,c, LCs (b) and DETCs (c) embed between epithelial basal cell neighbours. Red, LCs (huLangerin-CreER;Rosa-stop-tdTomato); green, DETCs (CX3CR1-GFP+/−); white, nuclei of epithelial cells (K14-H2B-Cerulean). Representative images from three mice. Scale bars, 10 μm. d, Direct contact of epithelial basal cells (K14-H2B-Cerulean) with LCs (huLangerin-CreER;Rosa-stop-tdTomato) (magenta spheres), DETCs (CX3CR1-GFP+/−) (cyan spheres) and with both LCs and DETCs (yellow spheres). Representative images from 3 mice; scale bar, 20 μm. e, Quantification of cell–cell contacts between basal epithelial cell nuclei and LCs only, DETCs only, both LCs and DETCs or neither (n = 3 mice for each). Data are percentage ±s.d. f, Displacement track analysis of individual LCs (red) and DETCs (green). Top row: 4 h time lapse; bottom row: reimaging the same area every 24 h for 3 days. Representative images from three mice. Insets in top right corner show overlay of all individual tracks (rose plots), which represent the collective displacement of all tracked LCs and DETCs. Scale bars, 20 μm. g, Quantification length of displacement tracks. Data are mean ±s.d. with individual data points. Average size of cells is shown: red line, LCs (27.07 μm, n = 574 cells from 3 mice); green line, DETCs (18.86 μm, n = 390 cells from 3 mice); blue line, epithelial basal cells (8.30 μm, n = 600 cells from 3 mice). h,i, Time-lapse images show that the dendrites of LCs and DETCs explore junctional spaces with neighbouring epithelial basal cells: non-dividing (h) and dividing (i) cells. Red, LCs (huLangerin-CreER;Rosa-stop-tdTomato); green, DETCs (CX3CR1-GFP+/−); white, nuclei of epithelial cells (K14-H2B-Cerulean). Representative images from 3 mice; scale bars, 5 μm.

