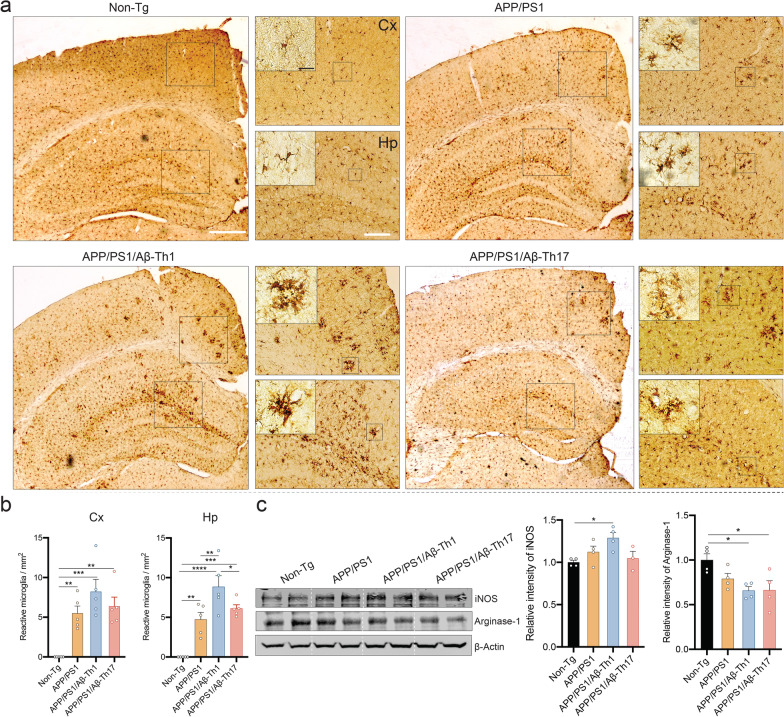
Fig. 7.
Aβ-Th1 and Aβ-Th17 cells activate microglia in APP/PS1 mice. a Immunohistochemistry performed to quantify number of reactive Iba1+ microglia cells in cortex and hippocampus brain regions. Representative pictures showing Iba1-reactive cells in different brain regions. Scale bar = 100 µm. Area with most Iba1-reactive cells highlighted by inserts for the cortex and hippocampus. Microglia morphology shown in higher magnification images. Scale bar = 20 µm. b Number of Iba1+-reactive microglia cells were quantified using optical fractionator module of Stereo Investigator system (MBF Bioscience). n = 5 mice per group were analyzed. c Western blot analysis performed to determine expression of iNOS and arginase-1 using cortical tissue lysate for assessment of microglial phenotypes. Representative immunoblot and densitometric quantification were performed using n = 4 mice per group. Statistical significance between different experimental groups determined using one-way ANOVA followed by Newman–Keuls post hoc test. *p < 0.05, **p < 0.01, ***p < 0.001, ****p < 0.0001

